In-Depth Comparison: How AI Infographic Tools Empower Professional Design
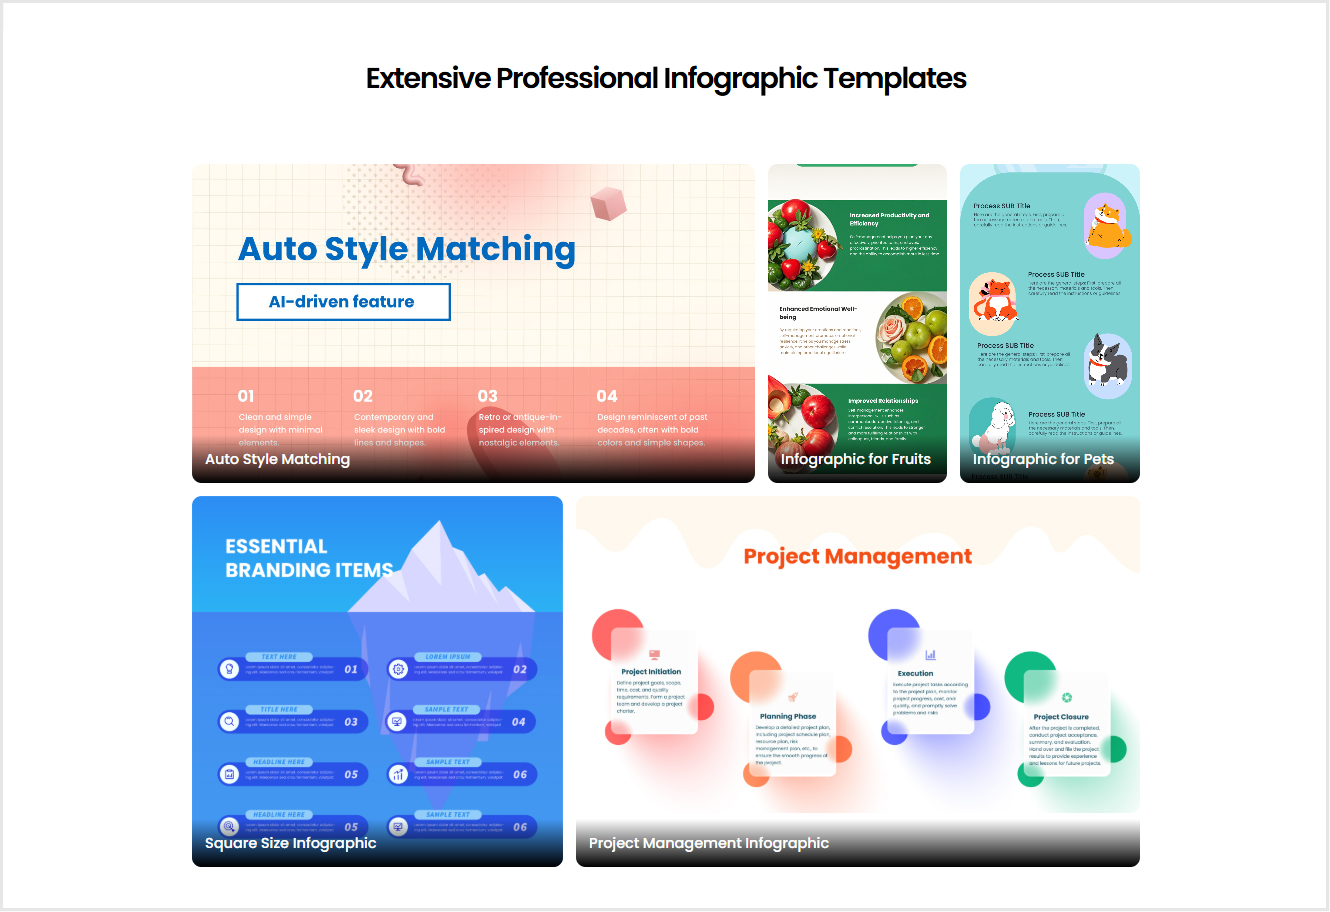
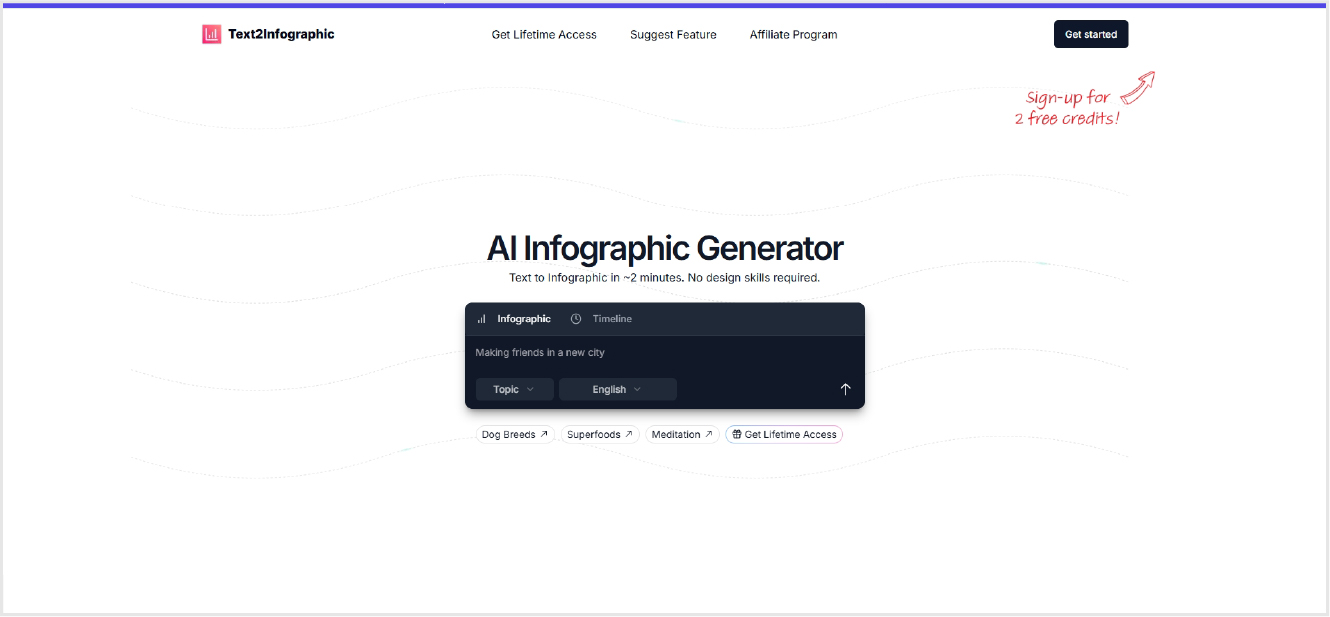
In today’s data-driven world, infographics have become essential for conveying complex information across industries like business, education, and finance. This article compares two AI-powered infographic tools (Link 1: AI Infographic Maker vs. Link 2: Text to Infographic) based on functionality, industry-specific adaptability, and professional requirements, offering actionable recommendations for users in key sectors.
1. Industry-Specific Adaptability Comparison
| Core Needs | Link 1: AI Infographic Maker | Link 2: Text to Infographic |
|---|---|---|
| Business Infographics | ✅ Strength: Business data templates, brand customization (colors/fonts/layout), real-time data updates. Ideal for corporate reports and product analysis. | ❌ Limited to basic text-to-chart conversion; lacks industry-specific customization. |
| Market Analysis Infographics | ✅ AI-driven trend detection, dynamic charts (e.g., line charts/heatmaps), real-time data source integration. | ❌ No data analysis features; relies on manual input for insights. |
| Educational Infographics | ✅ Clear template categorization (e.g., science/social themes), supports interactive charts and multi-level data visualization. | ❌ Generic output styles; struggles with complex knowledge structures. |
| Financial Infographics | ✅ Real-time data sync, dynamic KPI dashboards, cash flow visualization. Built for financial monitoring. | ❌ Static charts only; no live data integration. |
| HR Infographics | ✅ HR-specific templates (org charts, performance metrics), supports brand identity integration. | ❌ Lacks HR-focused design logic (e.g., no workforce analytics tools). |
2. Technical Capabilities Comparison
1.AI Intelligence
- Analyzes data trends and recommends optimal chart types (e.g., bar → heatmap).
- Real-time data synchronization (Excel/Google Sheets integration).
Generates layouts and color schemes aligned with industry standards (e.g., finance blue, education green).
- Converts text to basic charts only; no data-driven insights.
Limited to generic templates without industry-specific optimizations.
2.Customization & Brand Compliance
- Full control over fonts, color palettes, and chart proportions; supports corporate brand guidelines import.
- Dynamic logos and watermarks can be embedded.
- Limited style adjustments (preset themes and fonts).
- Fails to meet enterprise-level branding requirements.
3.Collaboration & Output Efficiency
AI Infographic Maker:Team collaboration, multi-format exports (PDF/SVG/Interactive HTML).
Text to Infographic:: Single-user operation; outputs limited to PNG/JPG.
4. Final Recommendation: 5 Reasons to Choose AI Infographic Maker
- Industry-First Solutions: Templates for Financial Infographics (real-time dashboards) and HR Infographics (org charts) address niche demands.
- Dynamic Data Integration: Automatically updates Market Analysis Infographics to reflect live trends.
- Brand Consistency: Customizable design elements ensure compliance with Business Infographics standards.
- Long-Term Cost Savings: AI automation cuts 90% of design time, ideal for institutions producing Educational Infographics regularly.
- Future-Proof Technology: Supports interactive charts and cross-platform collaboration, paving the way for advanced tools (e.g., AR/VR infographics).
Conclusion
For users prioritizing professionalism, brand alignment, and live data capabilities (e.g., enterprises, financial institutions, educators), AI Infographic Maker’s AI Infographic Maker is the superior choice. Its industry-tailored templates, AI-driven insights, and real-time updates solve critical visualization challenges in business, market analysis, education, and HR. Link 2’s lightweight tool suits personal users with basic text-to-chart needs.
AI Infographic Maker: Transform your data into industry-grade infographics with AI—where clarity meets impact!