2 Points Product Comparison Infographic Template Infographic Template
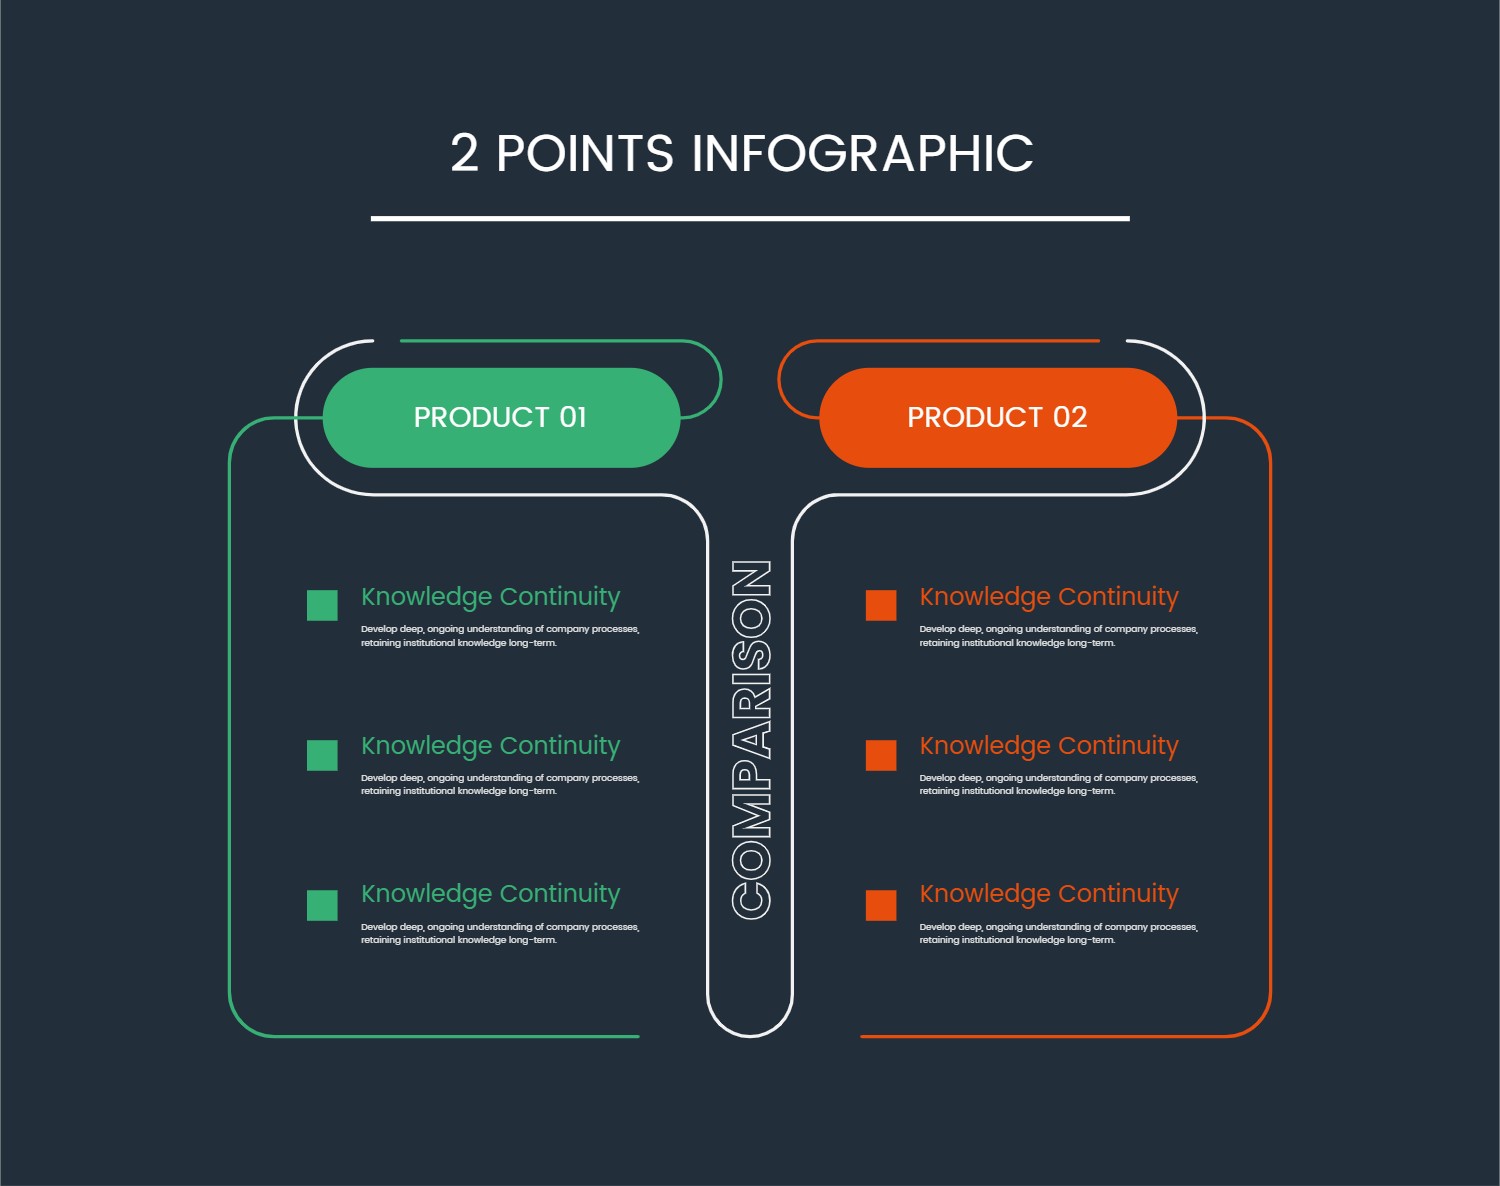
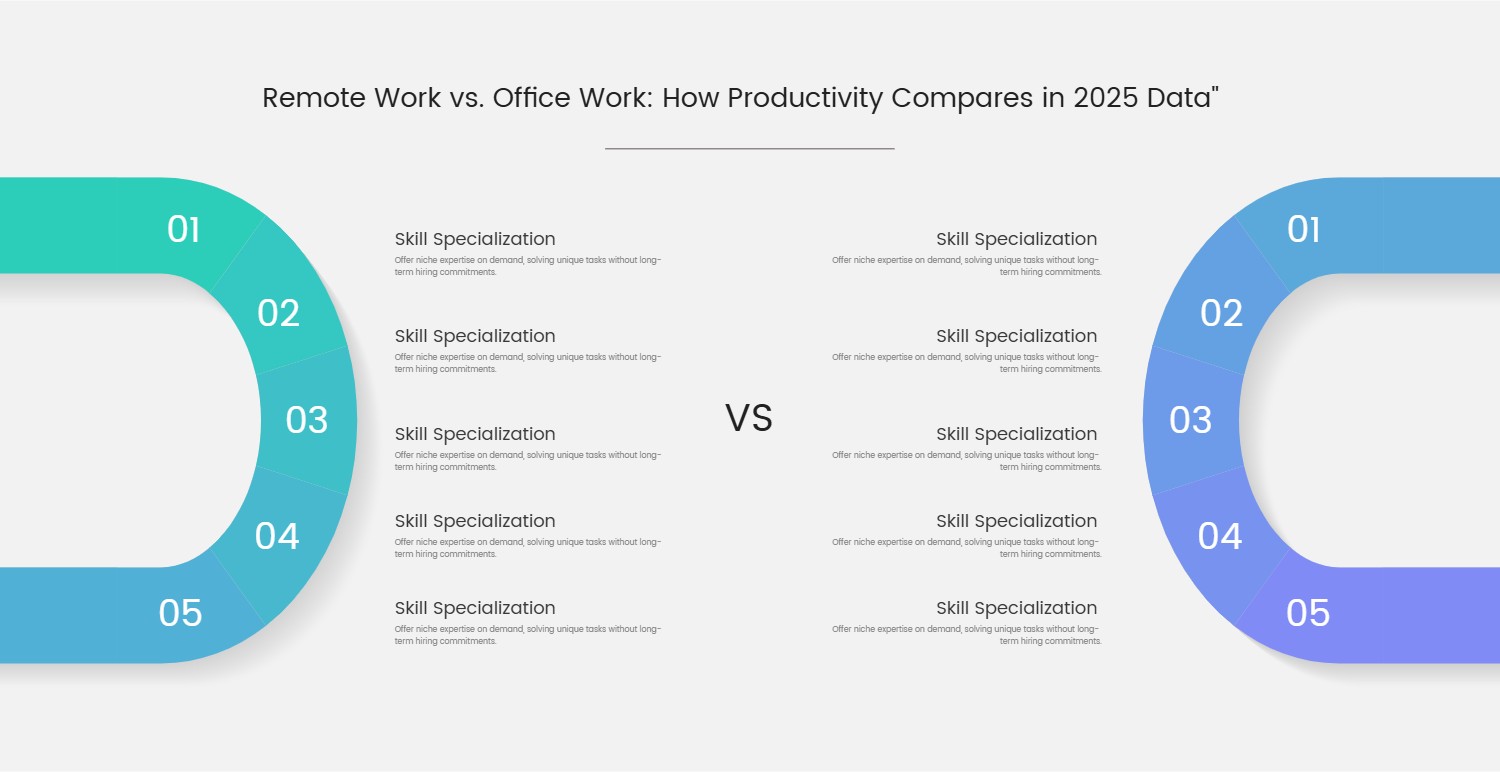
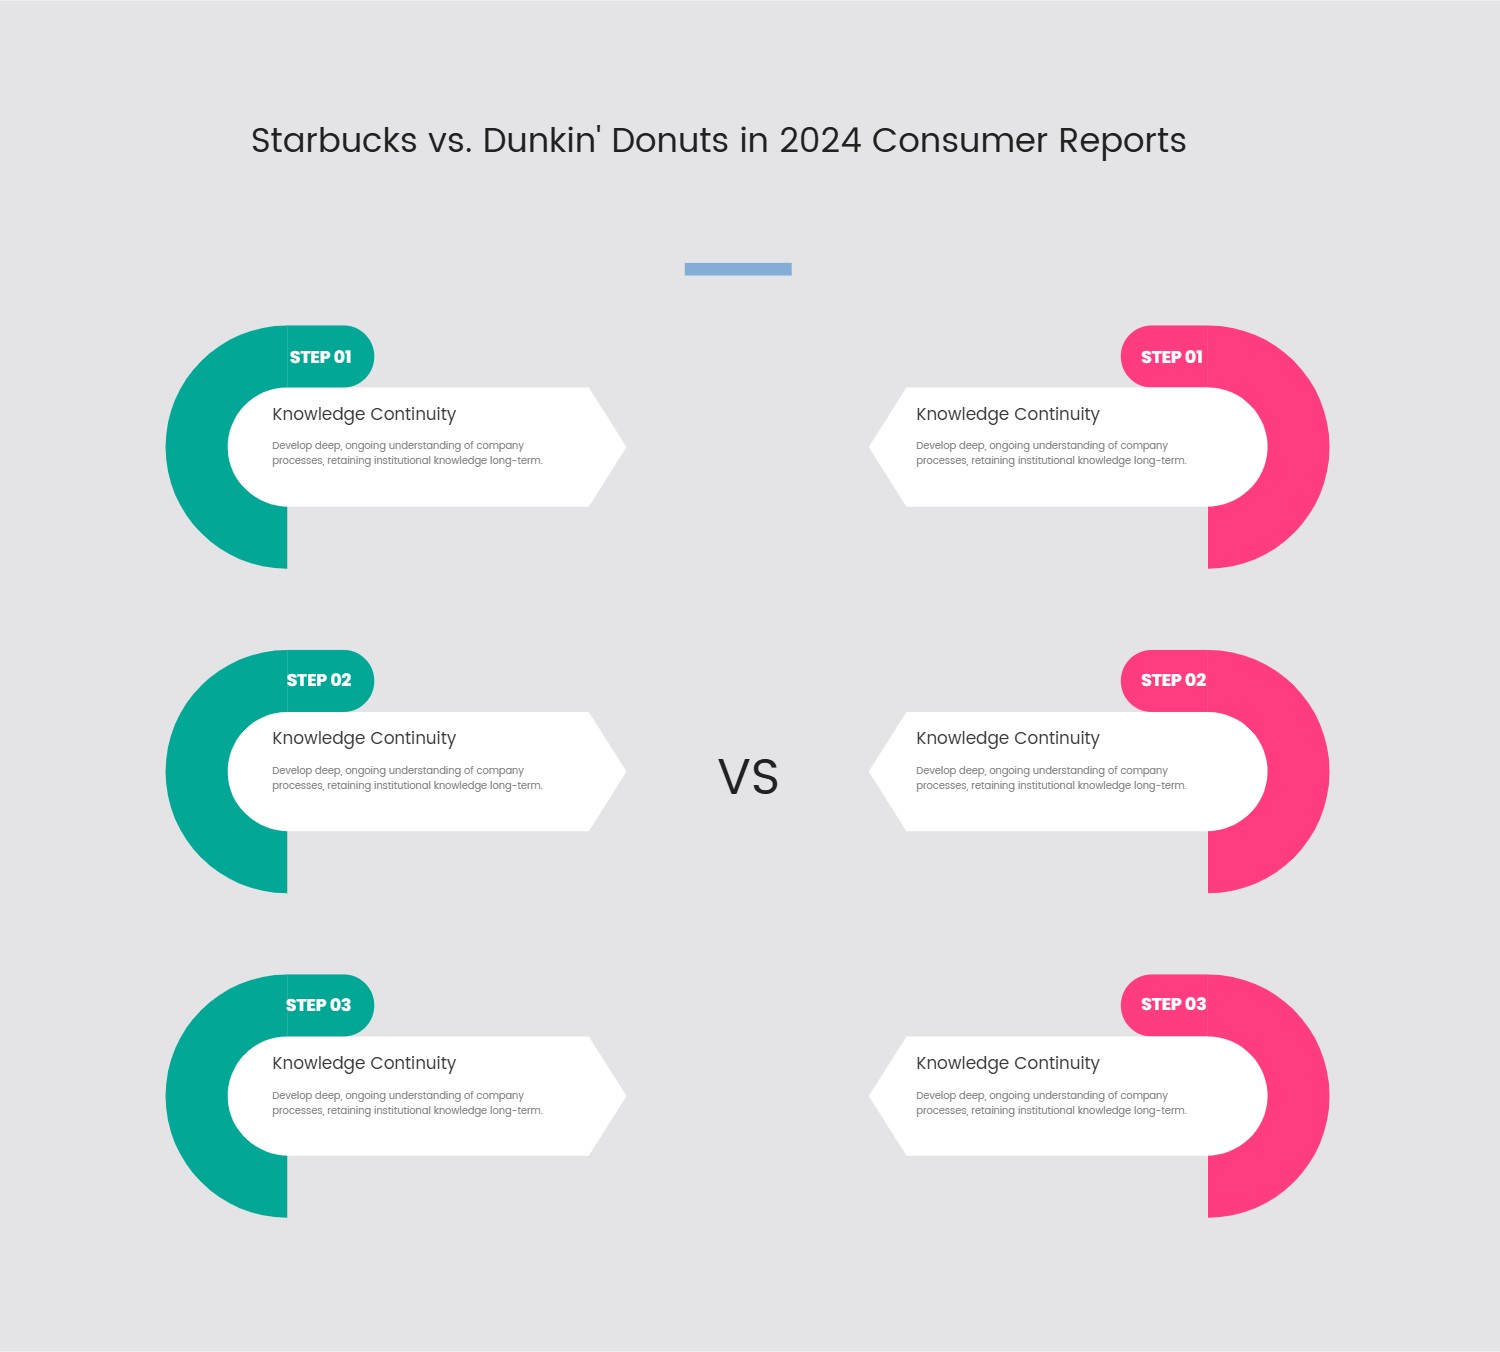
This infographic template presents a highly effective and visually appealing design for illustrating comparative data. Aptly named a "2 Points Infographic," its primary function is to clearly delineate and contrast two distinct concepts, products, services, or ideas. The layout features two prominent, vertically aligned sections, each with its own color scheme – vibrant green and striking orange – that immediately draw the eye and differentiate the two subjects. A central "COMPARISON" label elegantly bridges these sections, emphasizing the template's core purpose.
Each of the two main sections is designed to host multiple key attributes or details. Under a main heading, such as "PRODUCT 01" or "PRODUCT 02," a series of sub-points are presented, each featuring a concise title and a dedicated space for a brief descriptive explanation. This structured approach ensures that complex information is broken down into easily digestible segments, allowing the audience to quickly grasp specific aspects and their counterparts. The clean lines and thoughtful use of negative space contribute to its professional and uncluttered appearance.
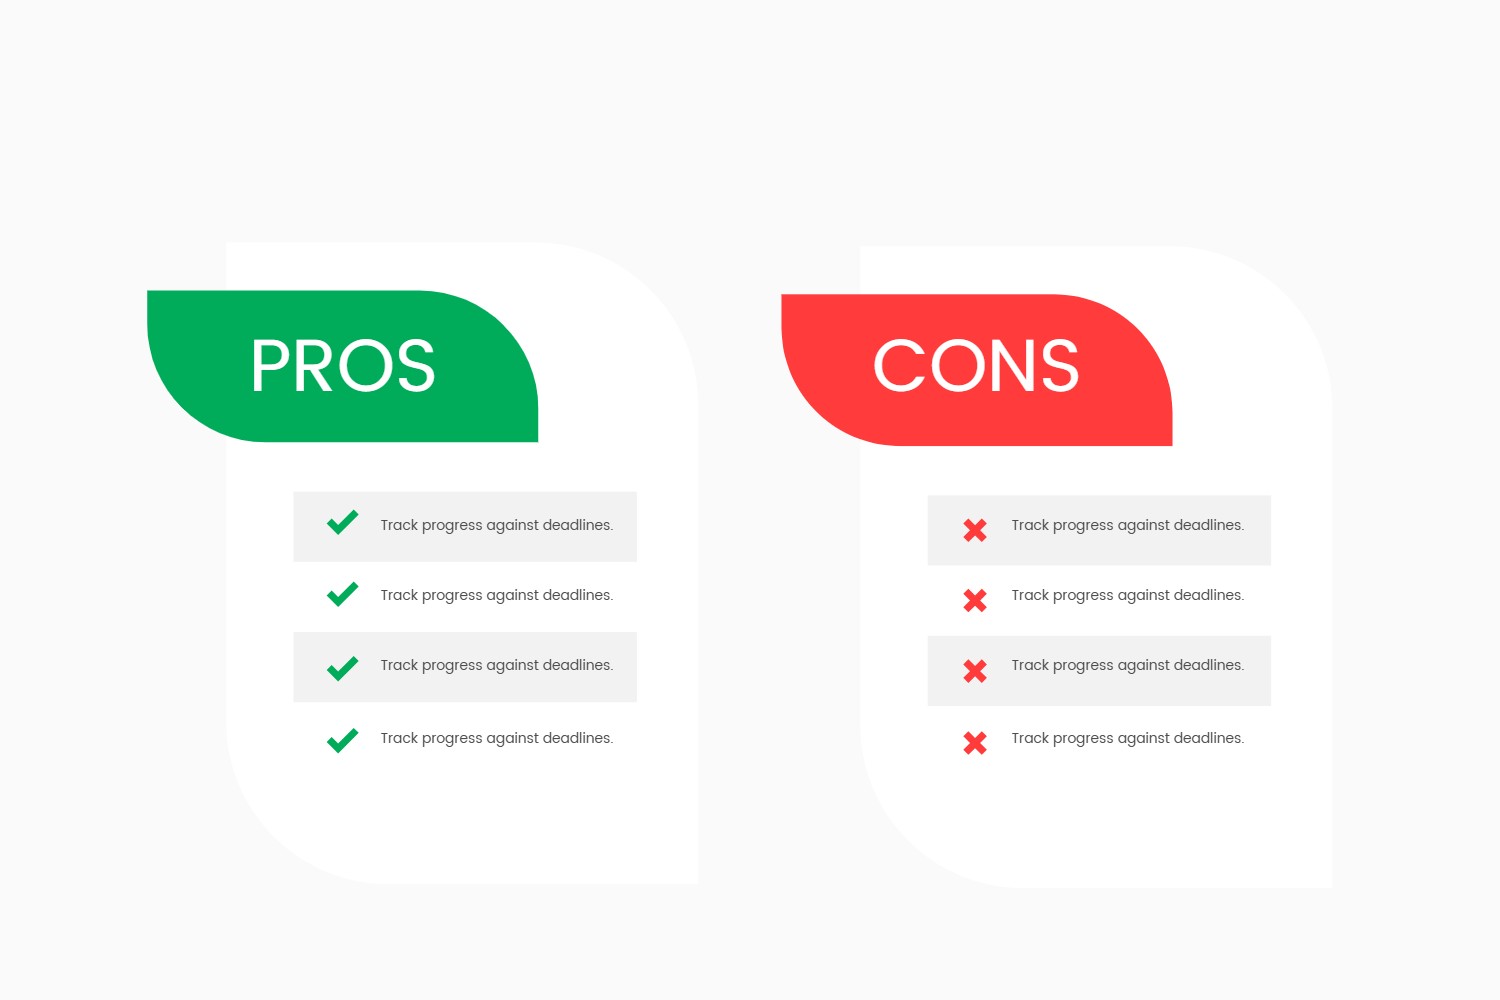
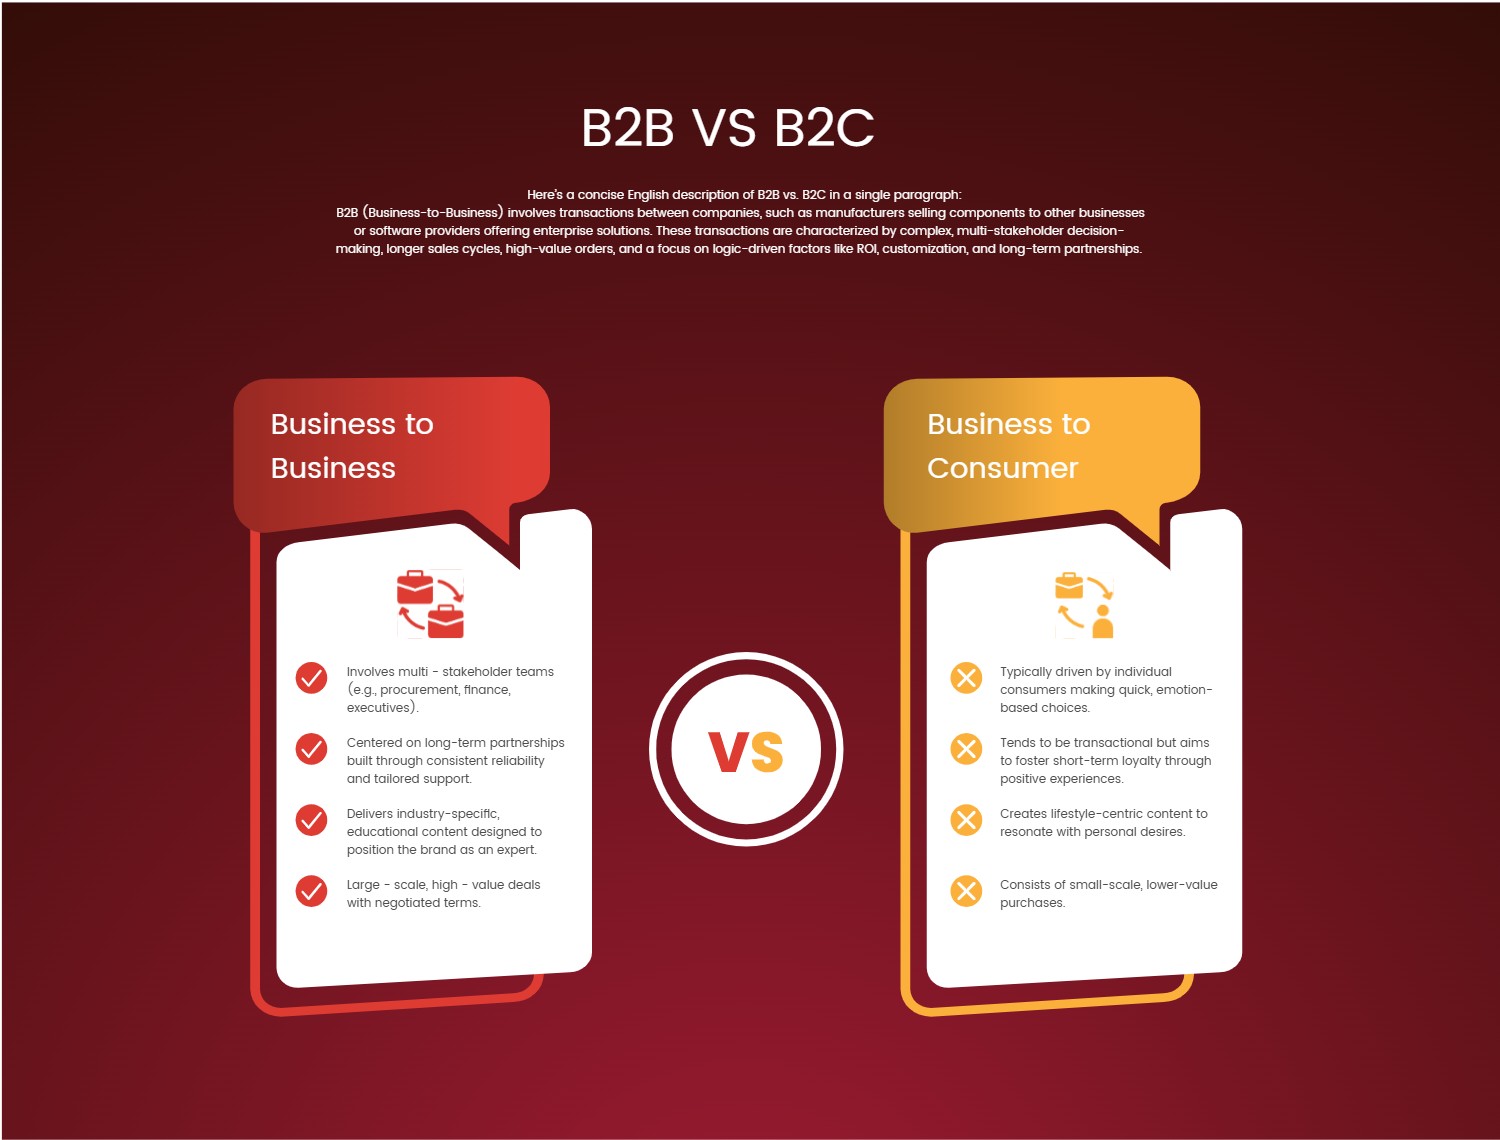
The versatility of this template makes it an invaluable tool across various domains. It is perfectly suited for business presentations comparing competing products, outlining different strategic approaches, or detailing the pros and cons of a decision. Educators can use it to compare historical events, scientific theories, or literary characters. Project managers might leverage it to showcase "before and after" scenarios or two alternative solutions. Its intuitive design facilitates clear communication, helping presenters convey intricate comparisons with clarity and impact, ultimately aiding in better understanding and informed decision-making.
#InfographicTemplate #ComparisonDesign #DataVisualization #PresentationTools #BusinessInfographic #EducationalContent #VisualCommunication
