Comparison Infographic Template with Three Steps and Curved Arrows Infographic Template
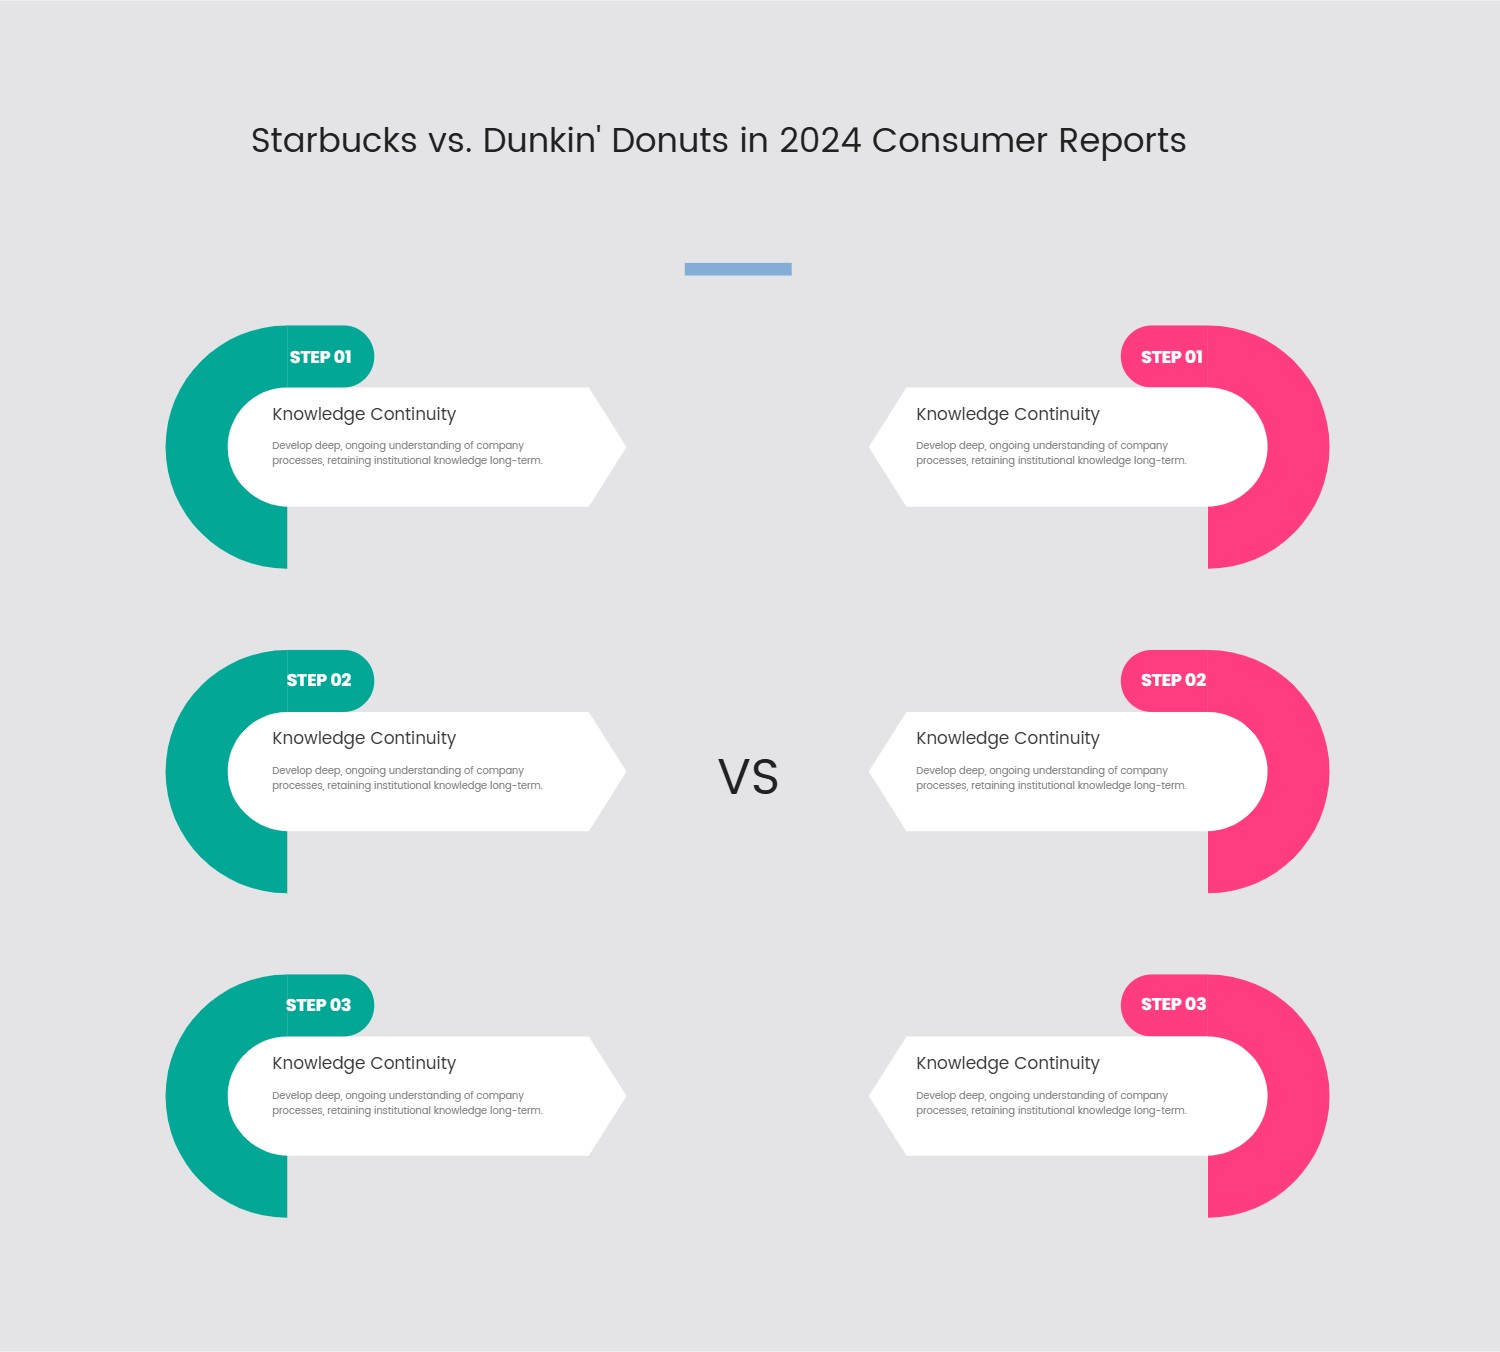
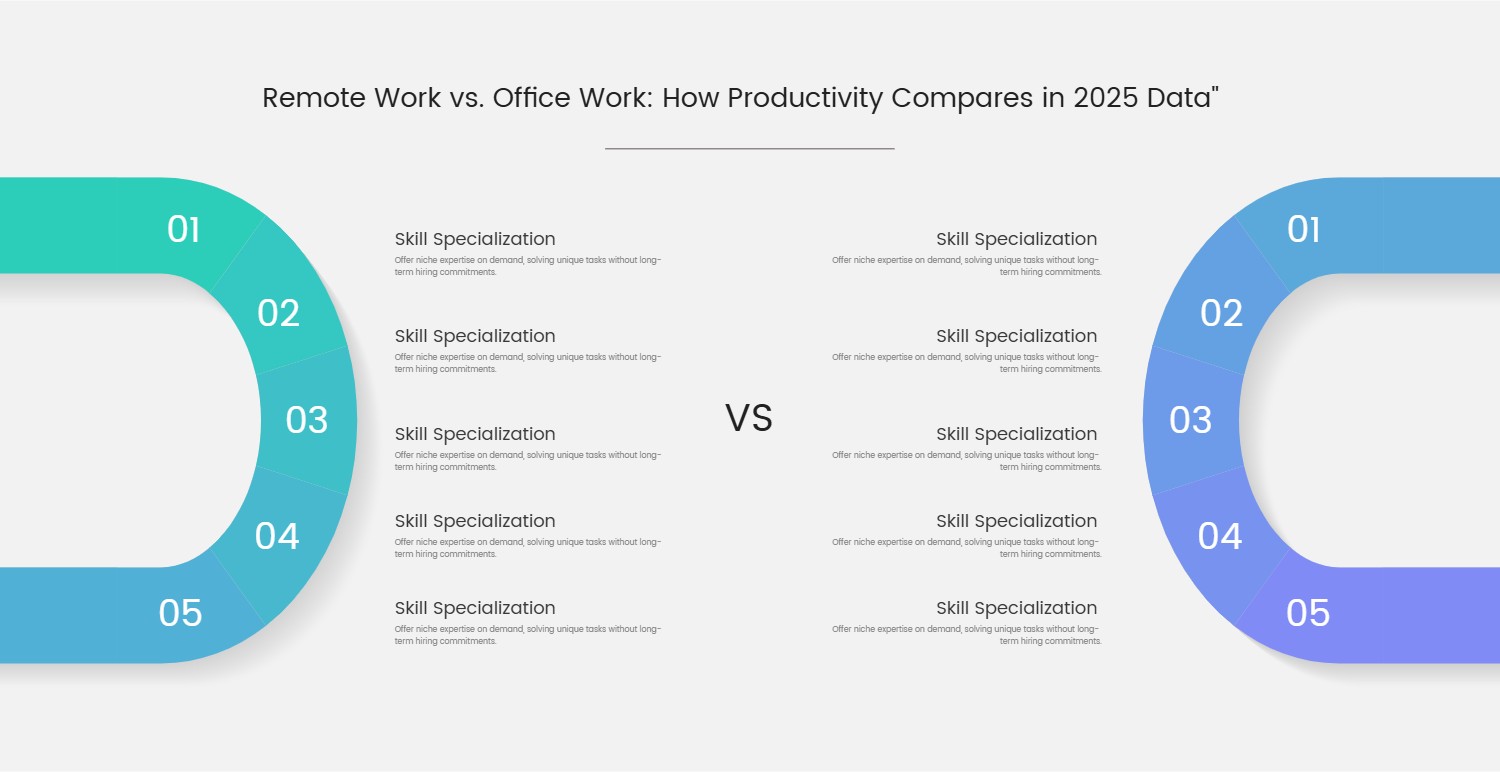
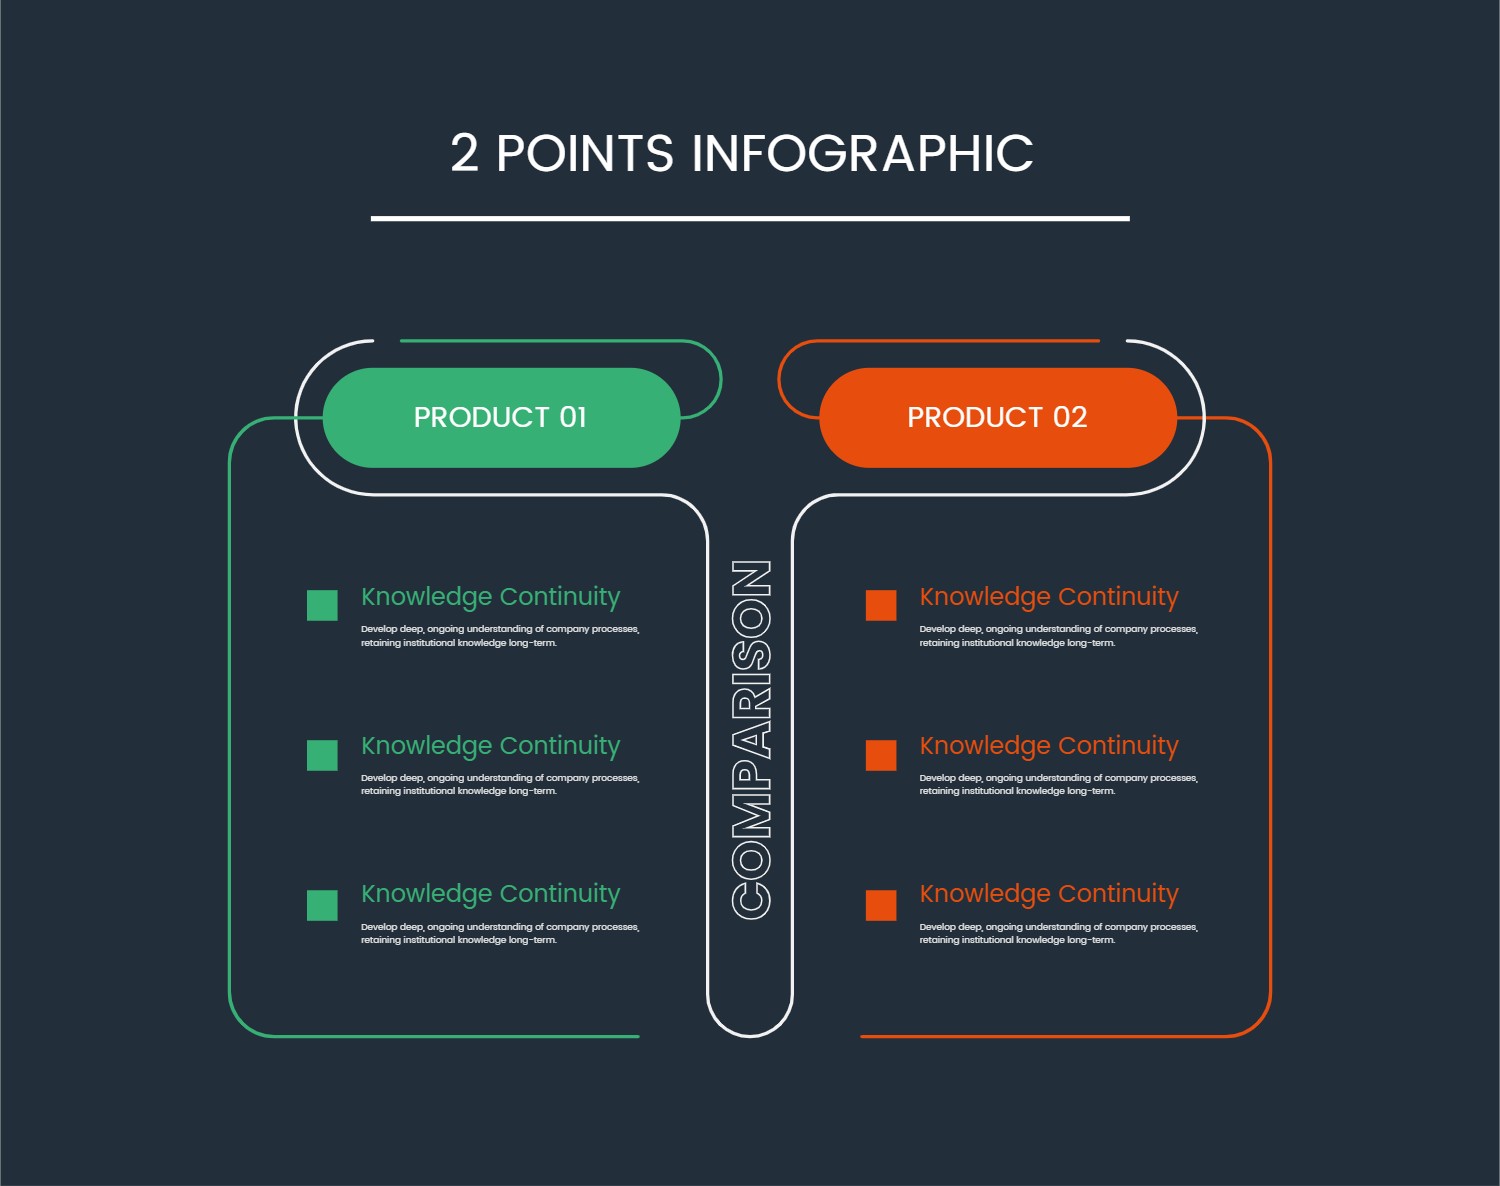
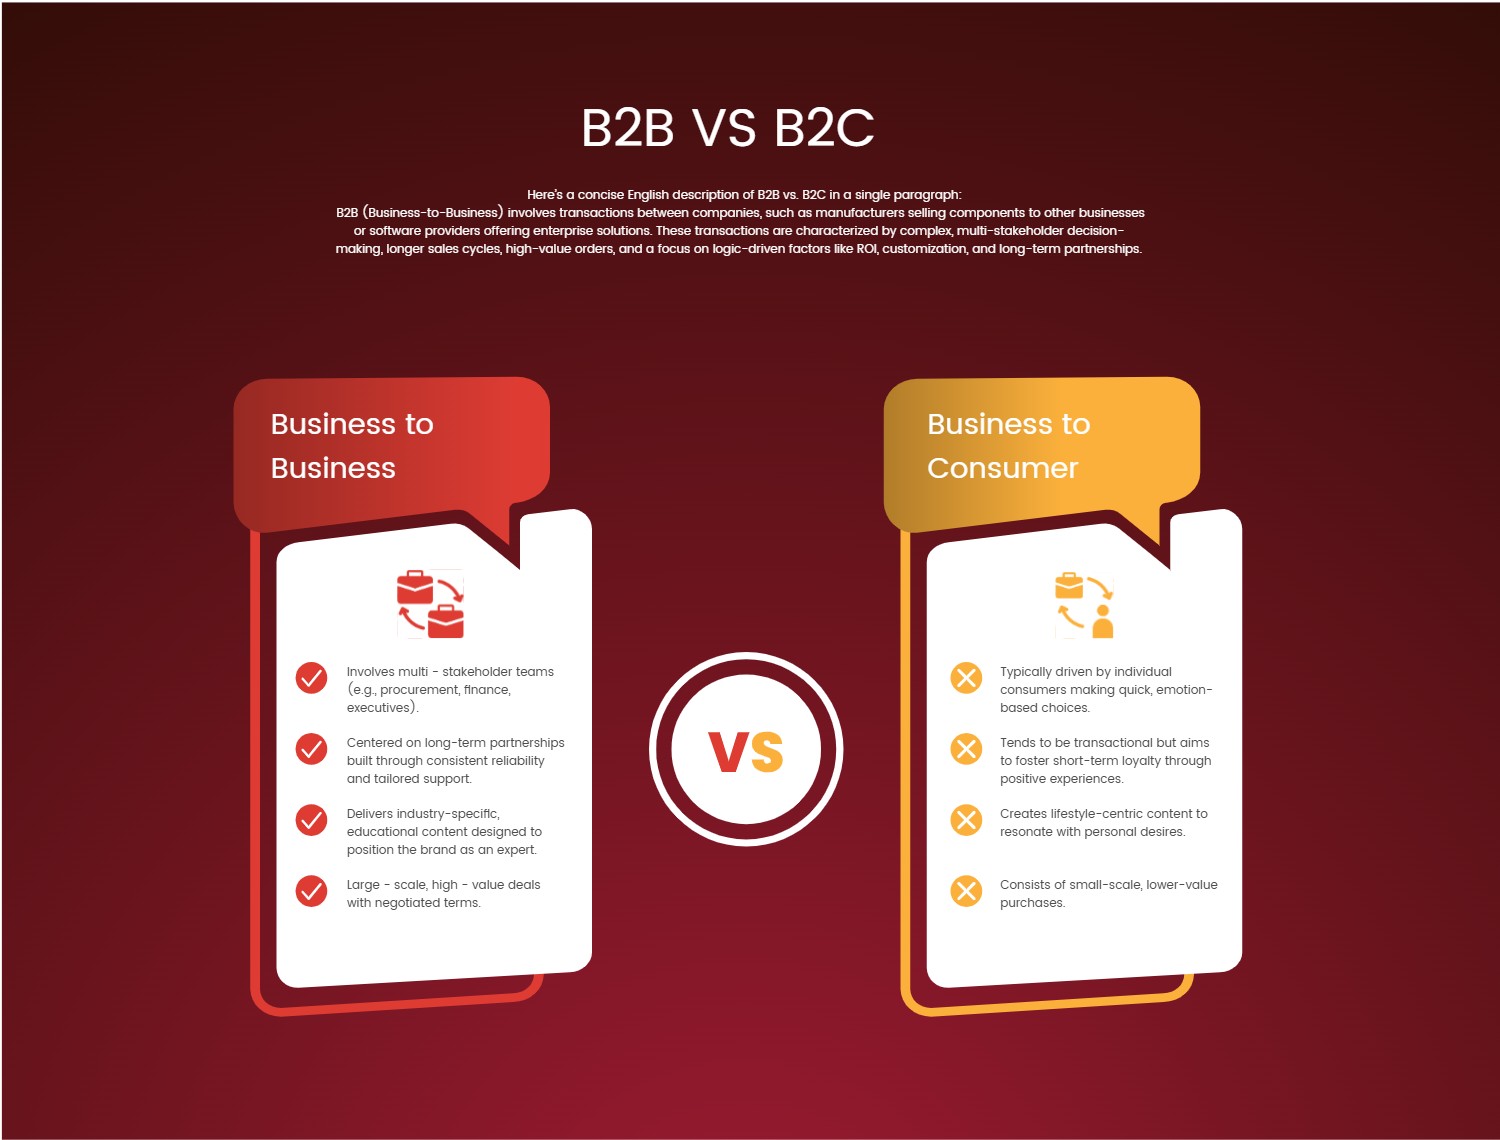
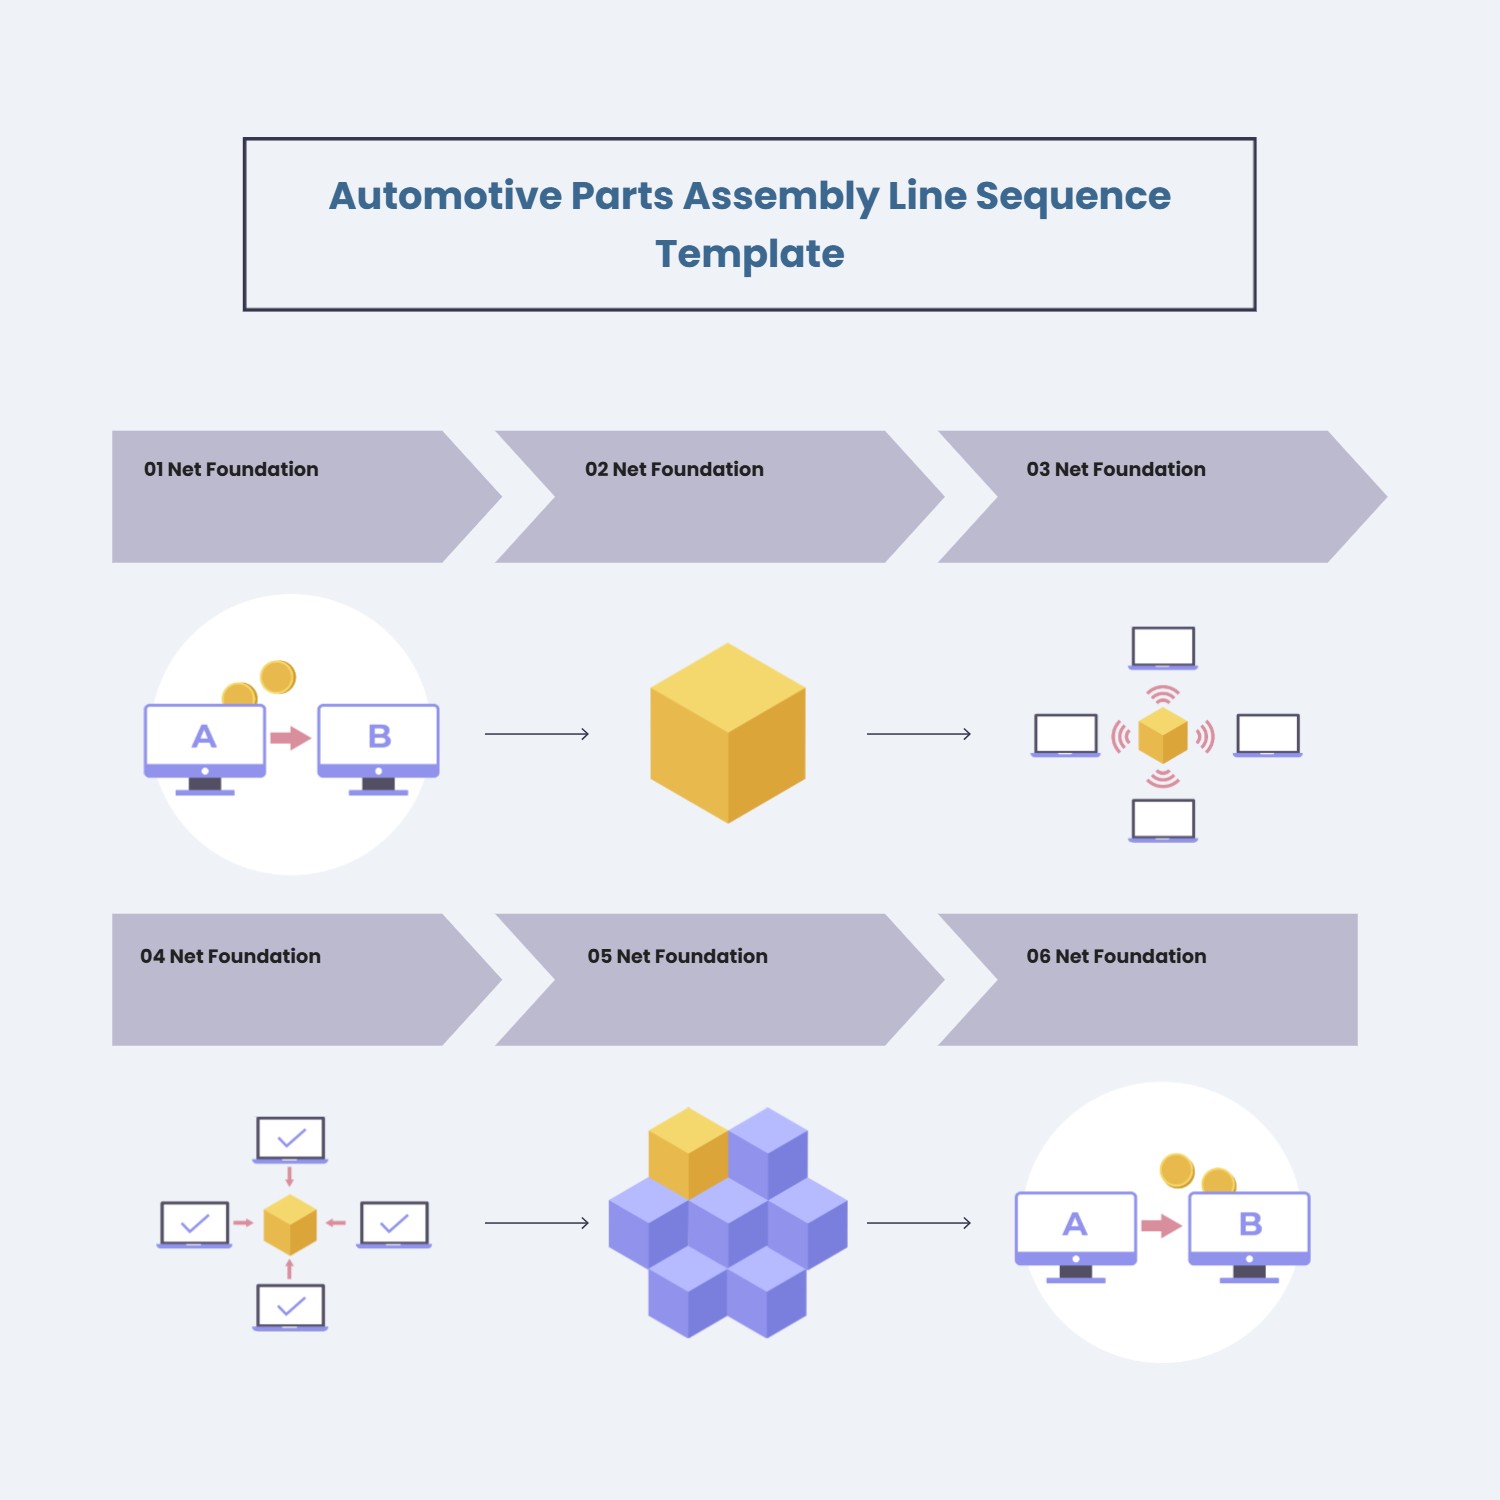
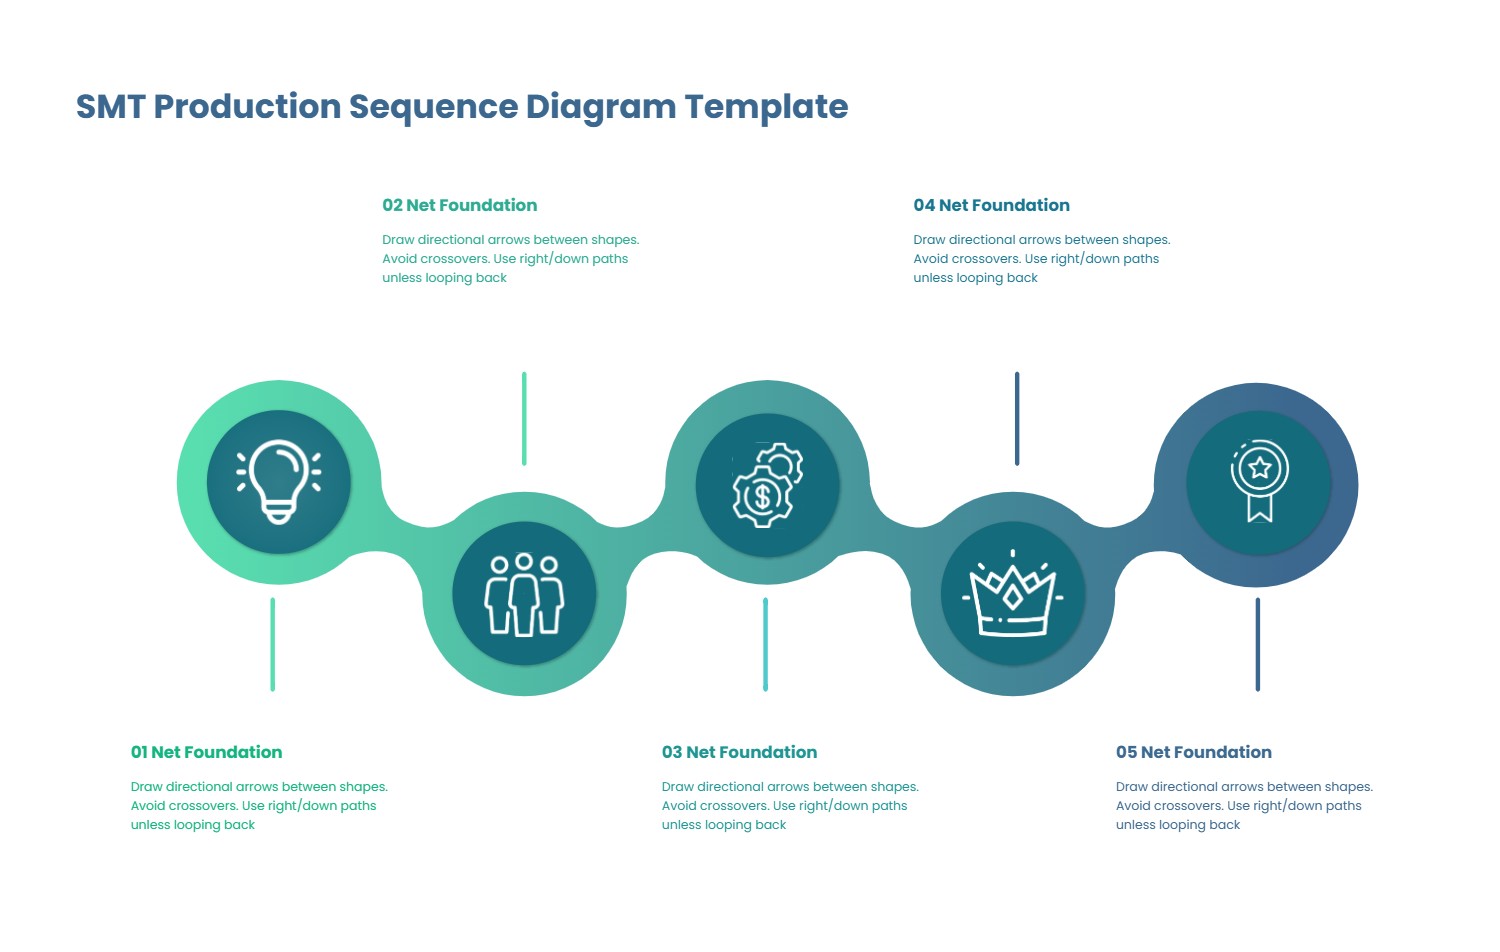
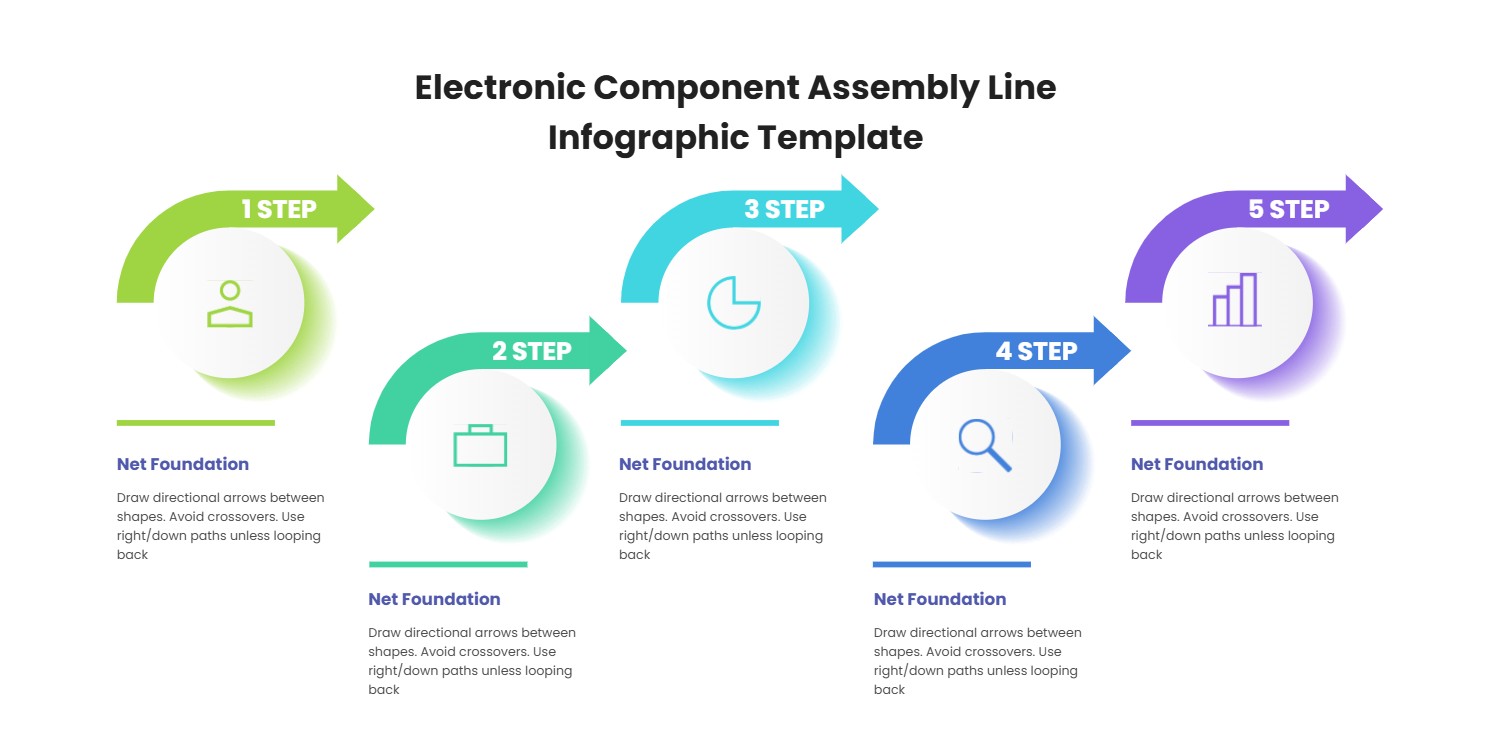
This versatile slide template offers a clean and dynamic layout for presenting comparative data or sequential processes. Designed with a clear "VS" demarcation at its core, it effectively facilitates a side-by-side analysis of two distinct entities, strategies, or datasets. Each side features three prominent, visually engaging steps, labeled "Step 01," "Step 02," and "Step 03," guiding the audience through a structured progression of information. This intuitive flow ensures a compelling narrative, transforming raw data into actionable insights.
The design employs distinct color palettes – a serene teal on the left and a vibrant pink on the right – to enhance differentiation and visual appeal. This color coding helps in instantly distinguishing between the two subjects being compared or the two parallel paths of a process. The unique curved arrow shapes for each step provide ample space for concise titles and detailed descriptions, ensuring clarity without clutter. The overall aesthetic is professional yet engaging, making complex information more accessible.
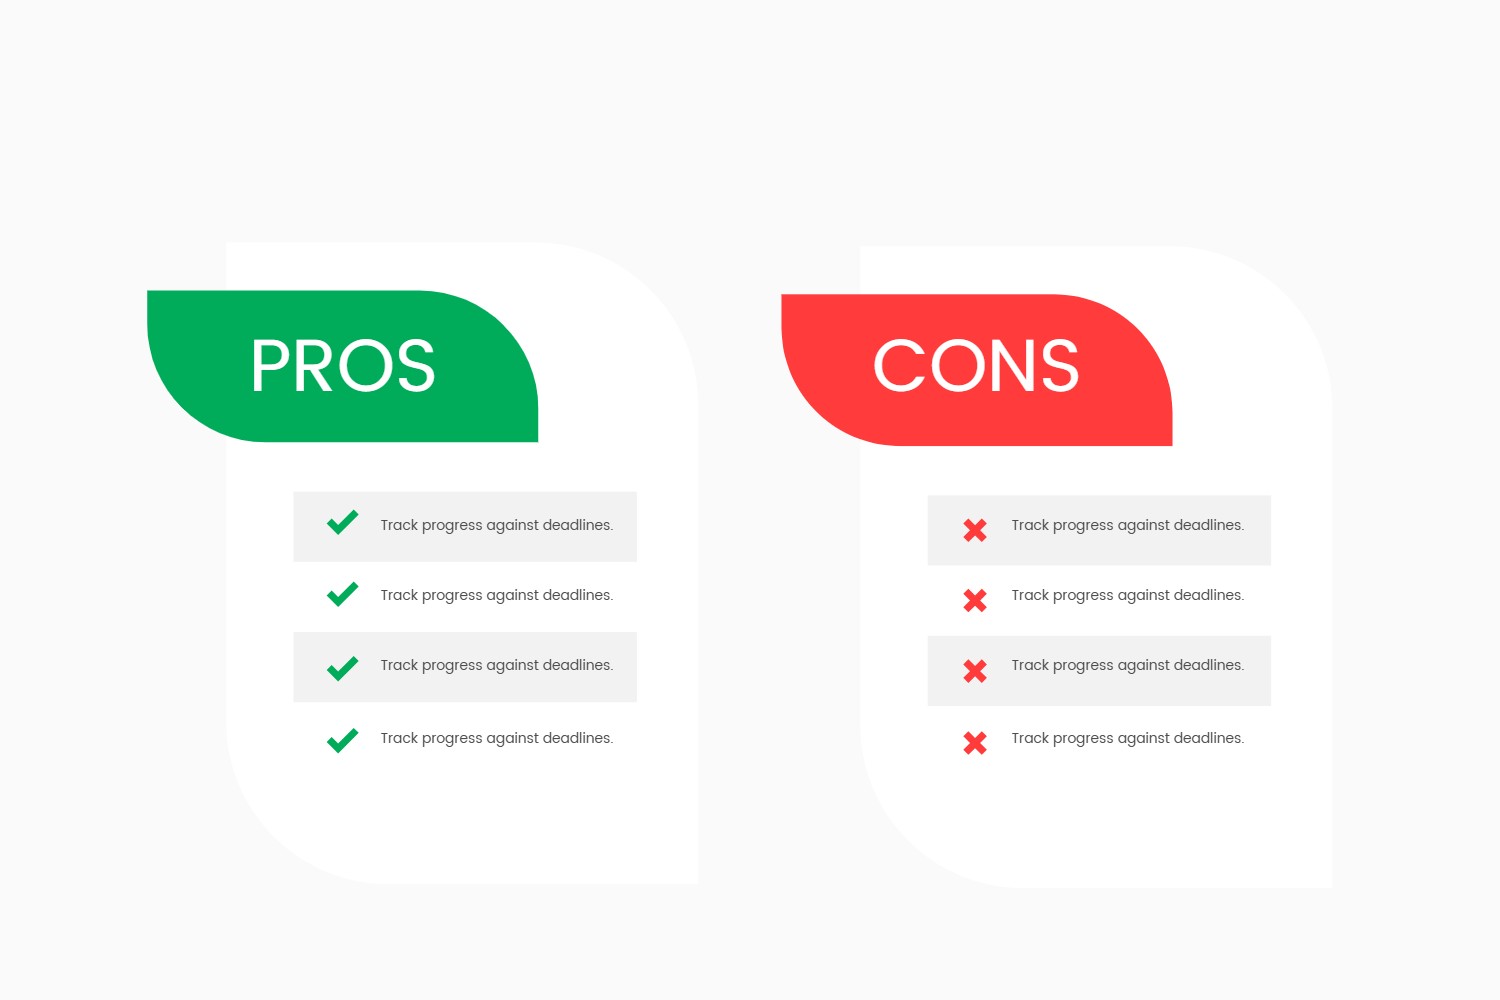
Ideal for business presentations, academic reports, or marketing analyses, this template excels in scenarios requiring a structured comparison, such as contrasting product features, competitor performance, strategic options, or the pros and cons of different approaches. It can also be adapted to illustrate two parallel multi-stage processes or timelines, effectively breaking down complex projects or workflows into digestible segments. Its flexibility makes it a powerful tool for conveying detailed information in a clear, concise, and visually appealing manner for any audience.
#PresentationTemplate #DataVisualization #ComparativeAnalysis #BusinessReport #StepByStep #Infographic #MarketingStrategy #ProcessFlow
