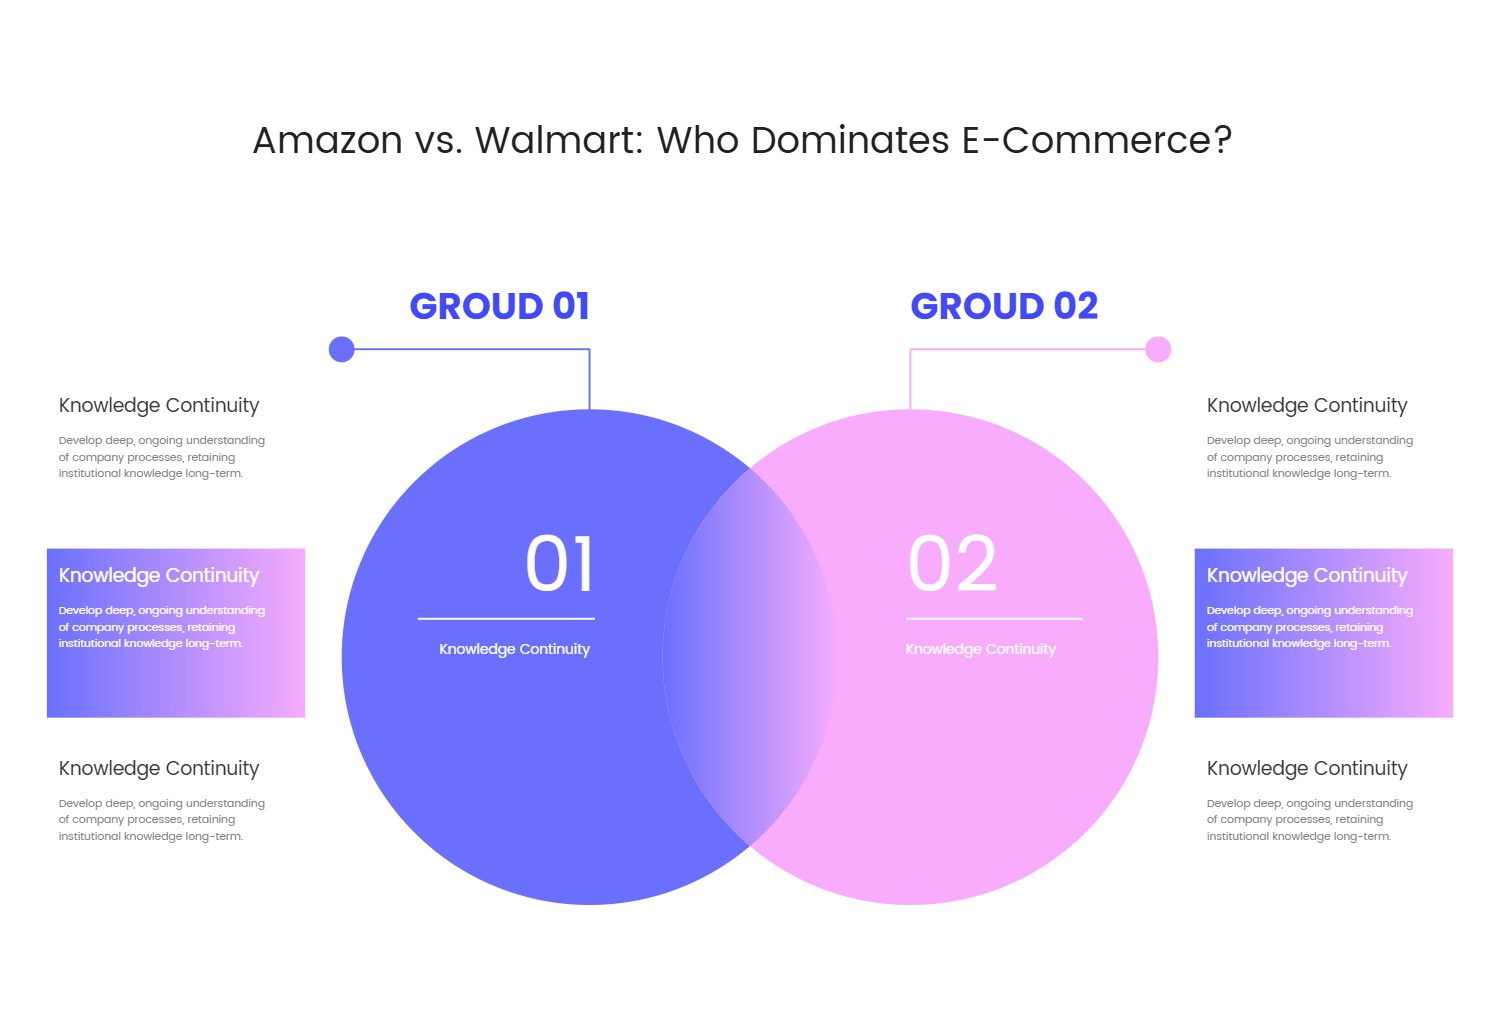
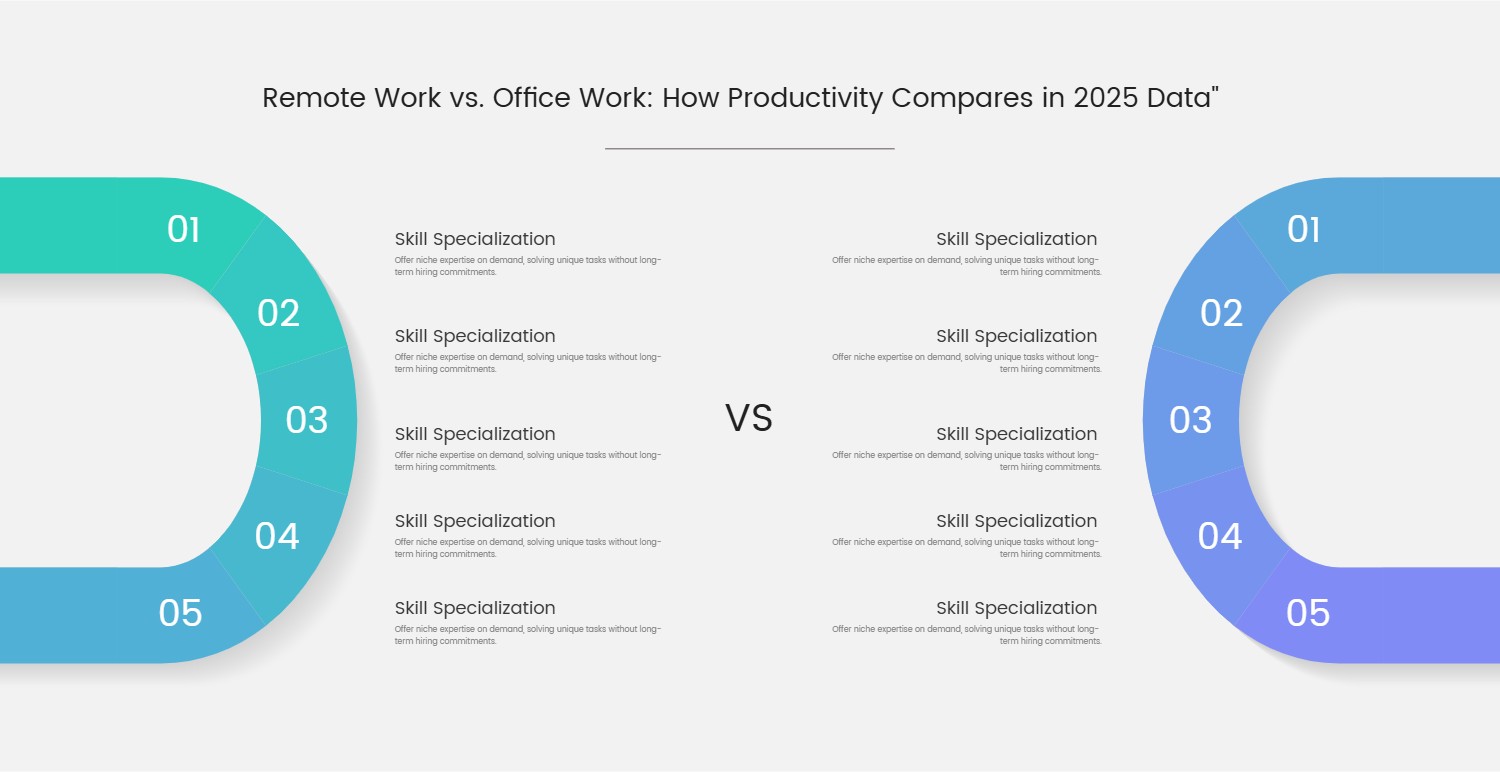
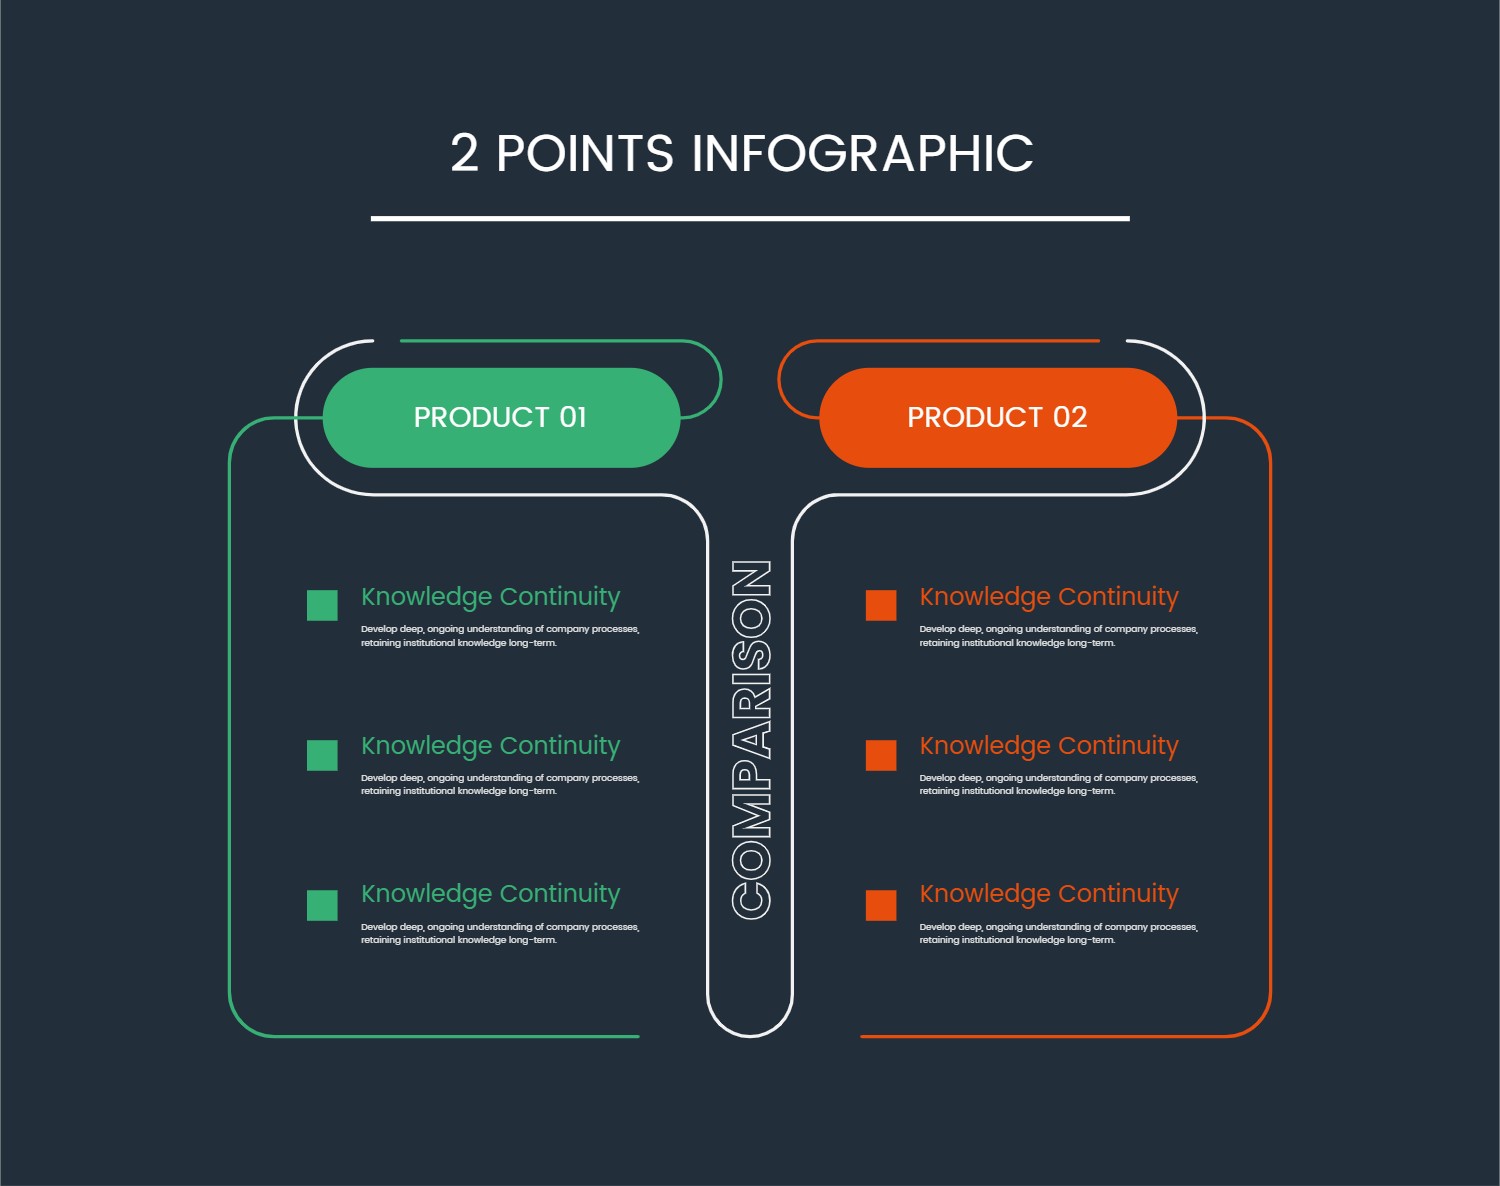
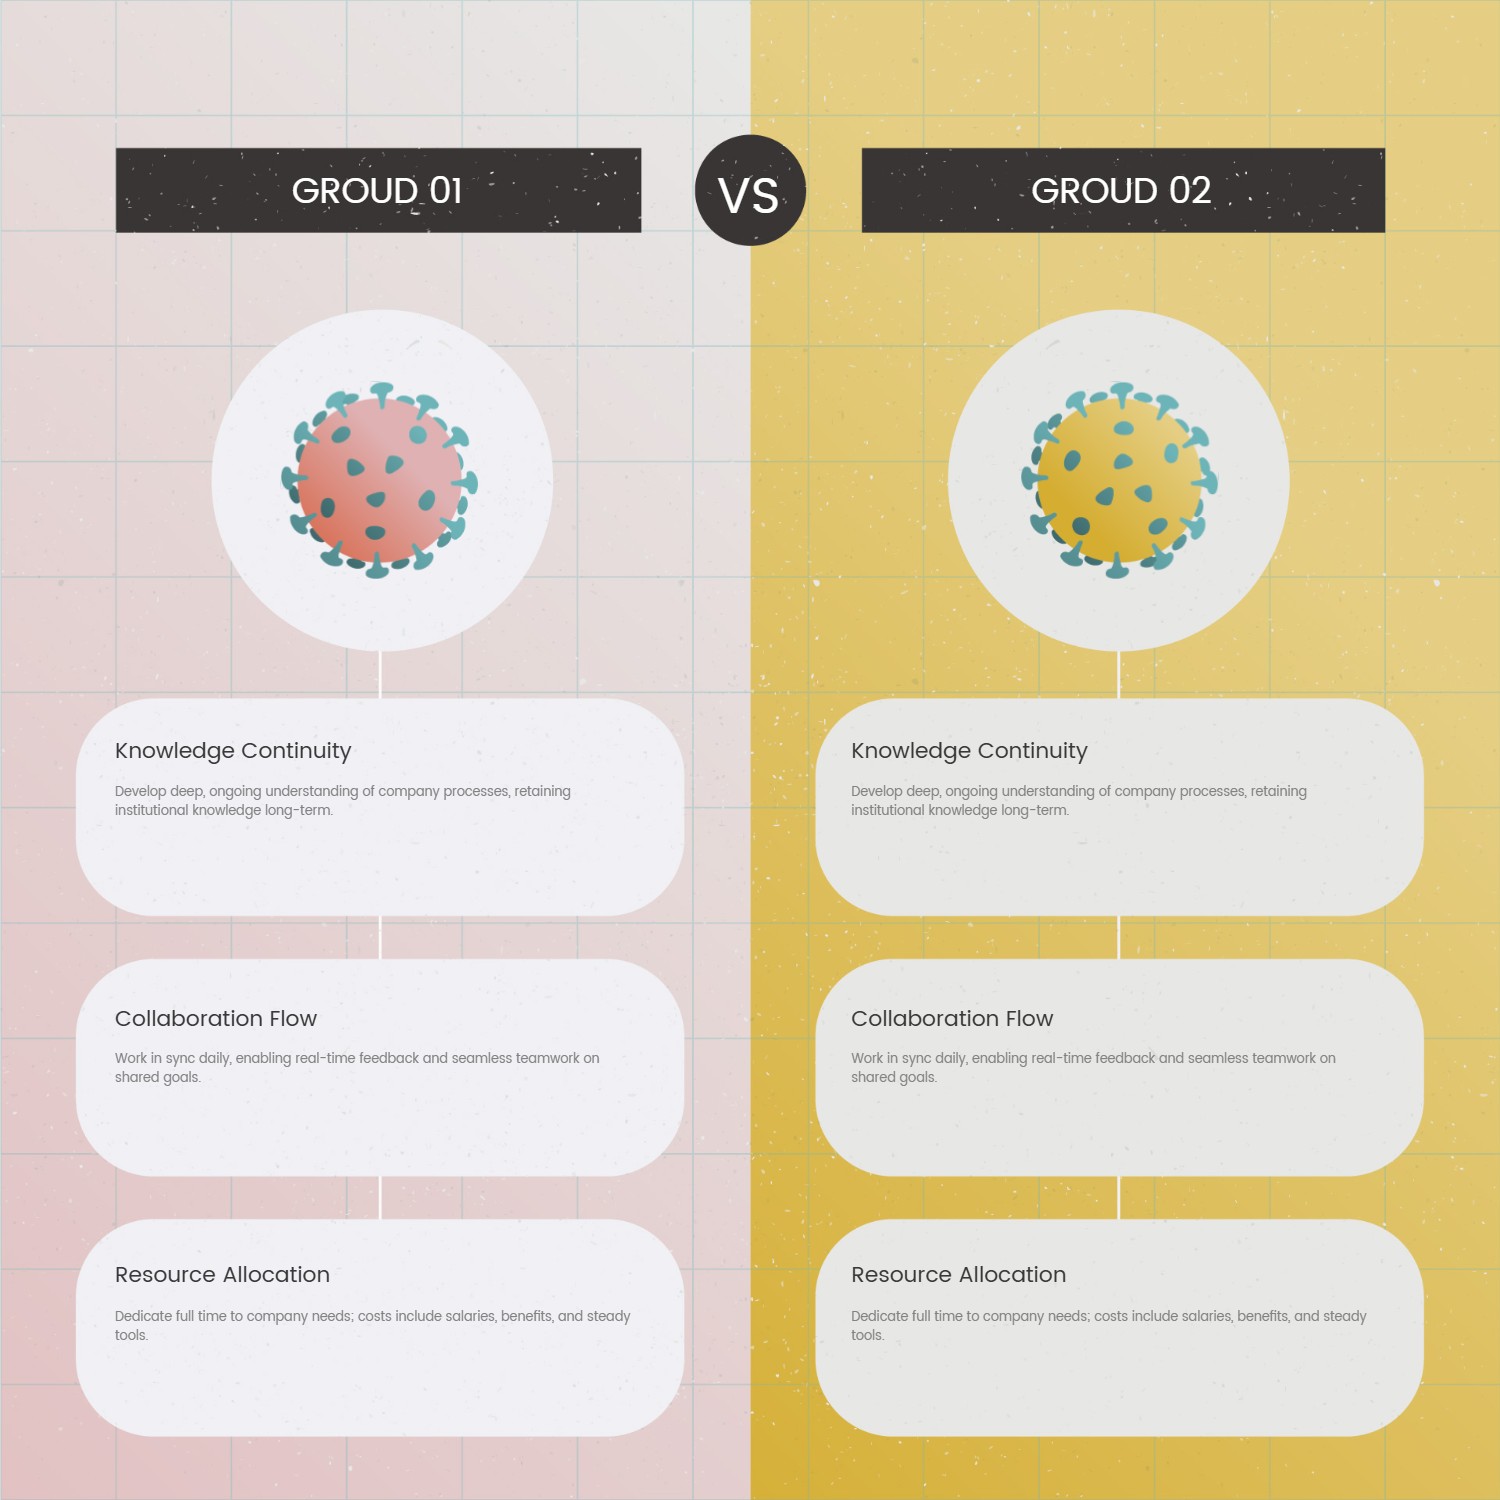
Venn Diagram Template for Comparing Two Groups with Detailed Descriptions Infographic Template
Visualizing Dual Comparisons
This versatile presentation template offers a clear and engaging way to visualize comparative data and complex relationships. Its design is centered around a prominent Venn diagram, artfully using two distinct, soft hues – a serene blue and a gentle pink – to represent two primary categories or concepts. This central visual element, clearly demarcated as "Group 01" and "Group 02," allows for an intuitive understanding of both individual characteristics and shared attributes, making intricate information easily digestible for any audience.
Structured for Clarity
The template is structured to support detailed explanations alongside its core visual. Each main circle, clearly marked with a large numeral "01" or "02," is accompanied by dedicated text areas. These sections provide ample space to elaborate on the specific points, characteristics, or arguments pertinent to each category. Furthermore, additional text boxes are strategically placed to offer more granular details, examples, or supporting evidence for the respective groups. This arrangement ensures that while the visual comparison is immediately graspable, deeper insights and contextual information are readily available without clutter.
Broad Applications
Ideal for a wide array of applications, this template excels in scenarios requiring the comparison of two distinct entities, ideas, or datasets. It can effectively illustrate market segment differences, product feature comparisons, team responsibilities, or the benefits and drawbacks of two different strategic approaches. Whether used in business strategy discussions, academic presentations, marketing analysis, or project management reviews, the clean layout and modern aesthetic ensure a professional and impactful delivery. Its adaptable structure makes it a powerful tool for simplifying intricate comparisons into a compelling, easy-to-follow narrative.
#PresentationTemplate #DataVisualization #VennDiagram #ComparativeAnalysis #BusinessPresentation #Infographic #SlideDesign #VisualCommunication
