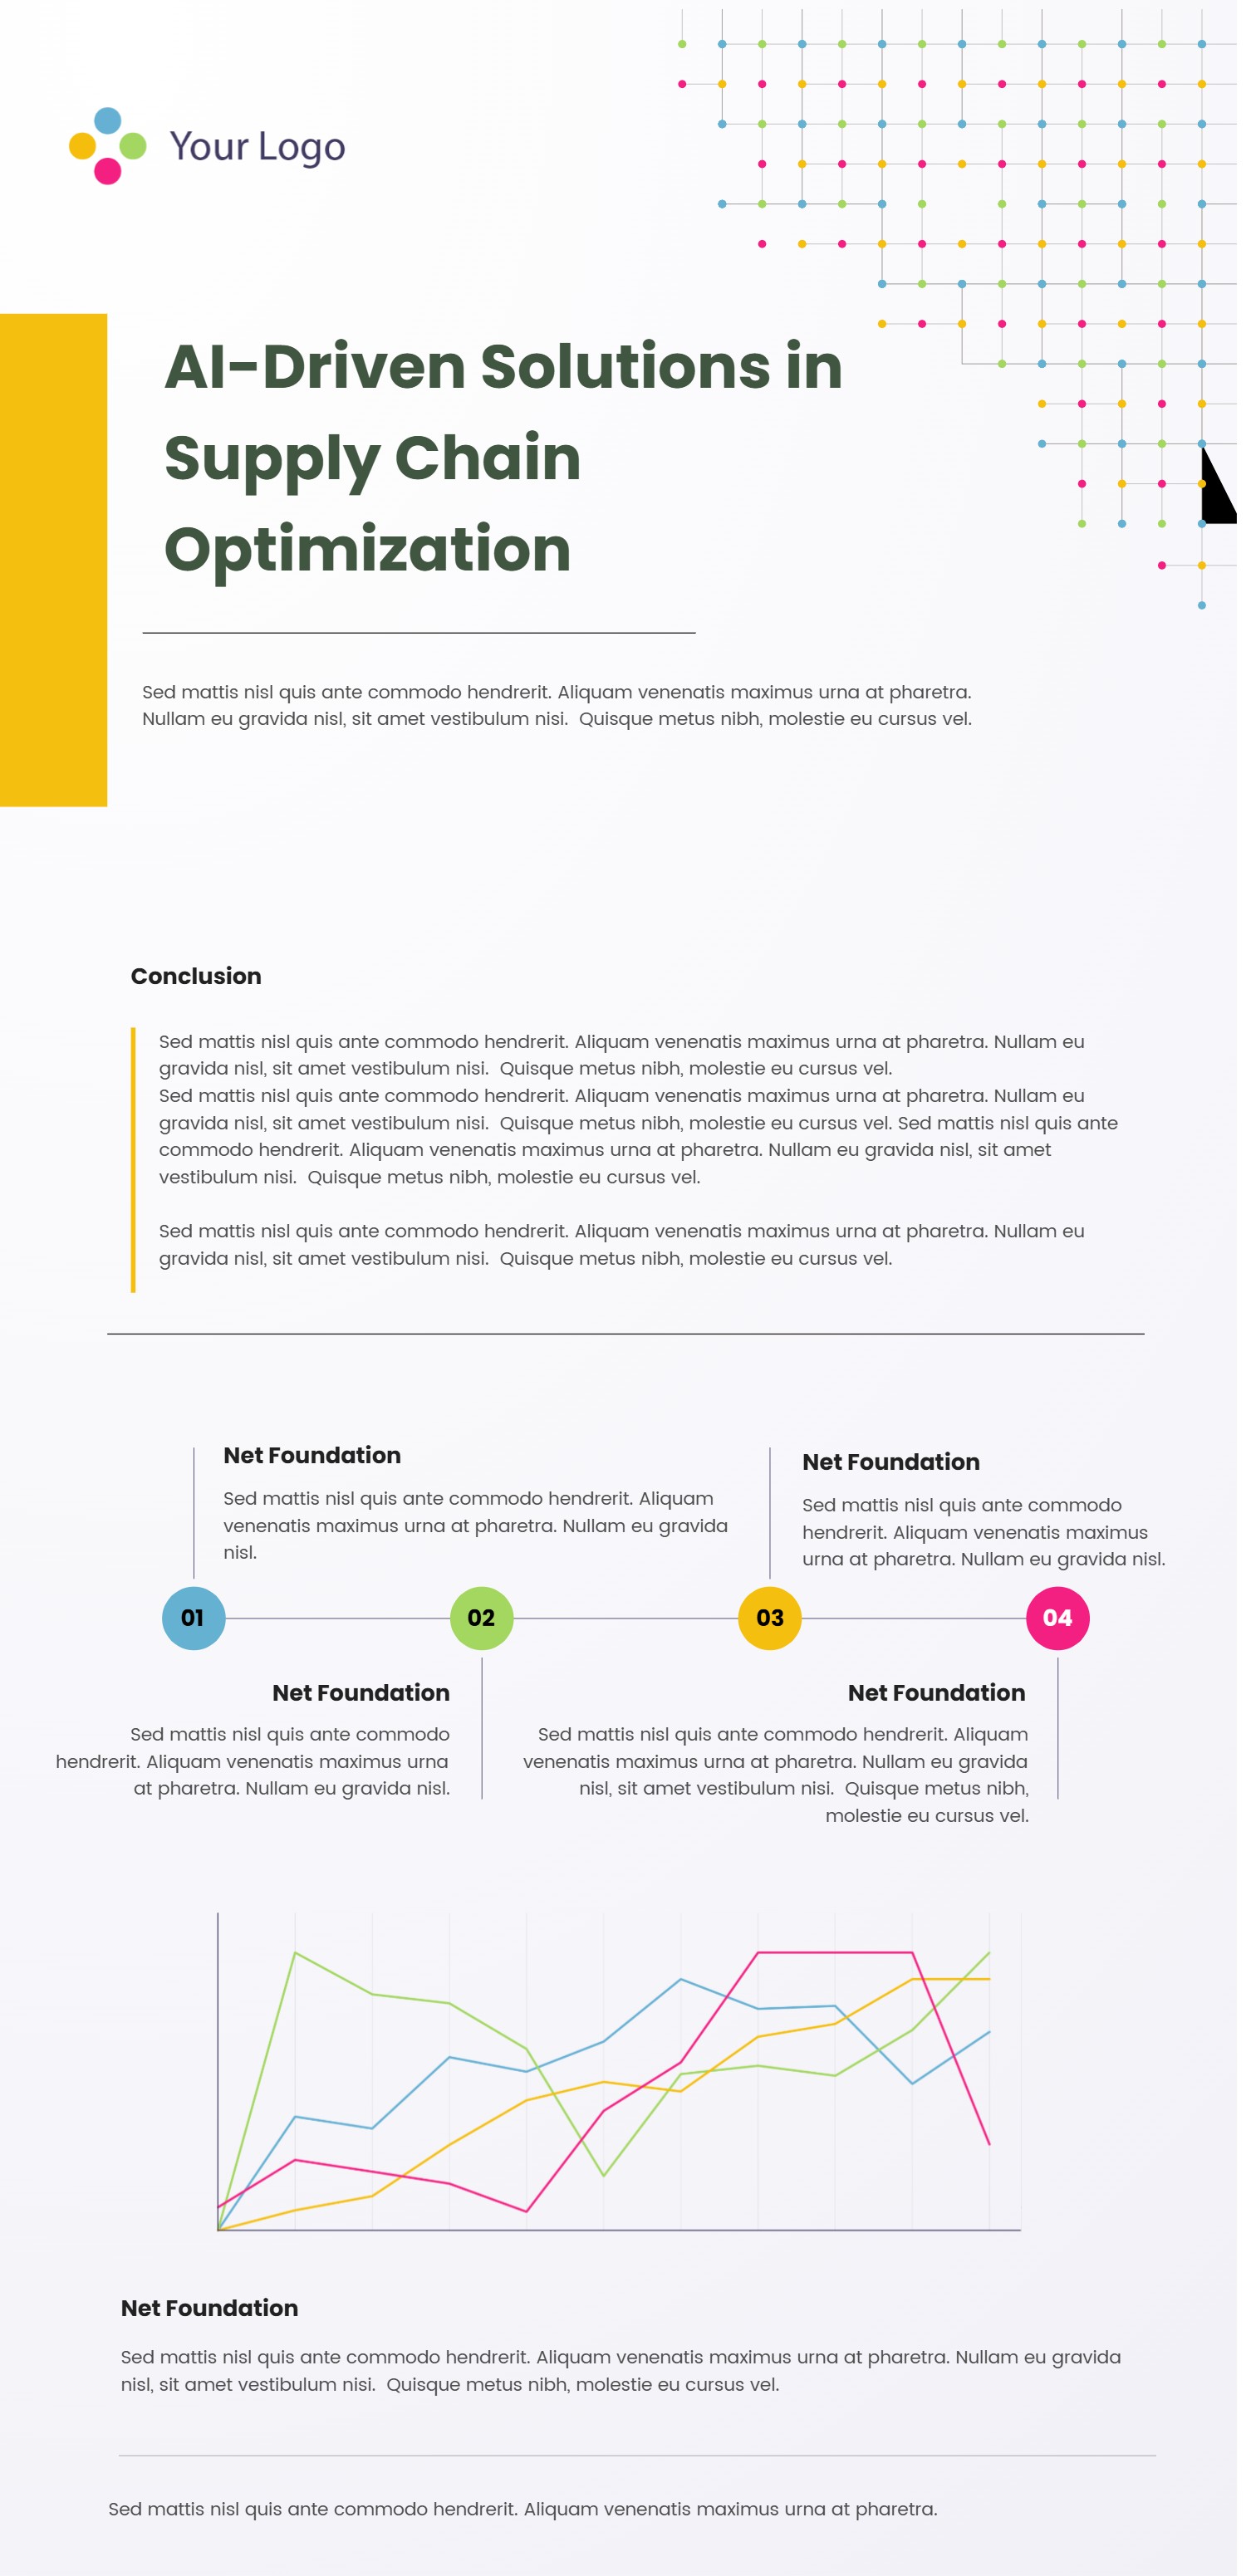
PowerPoint Vertical Timeline Template with Data Highlights
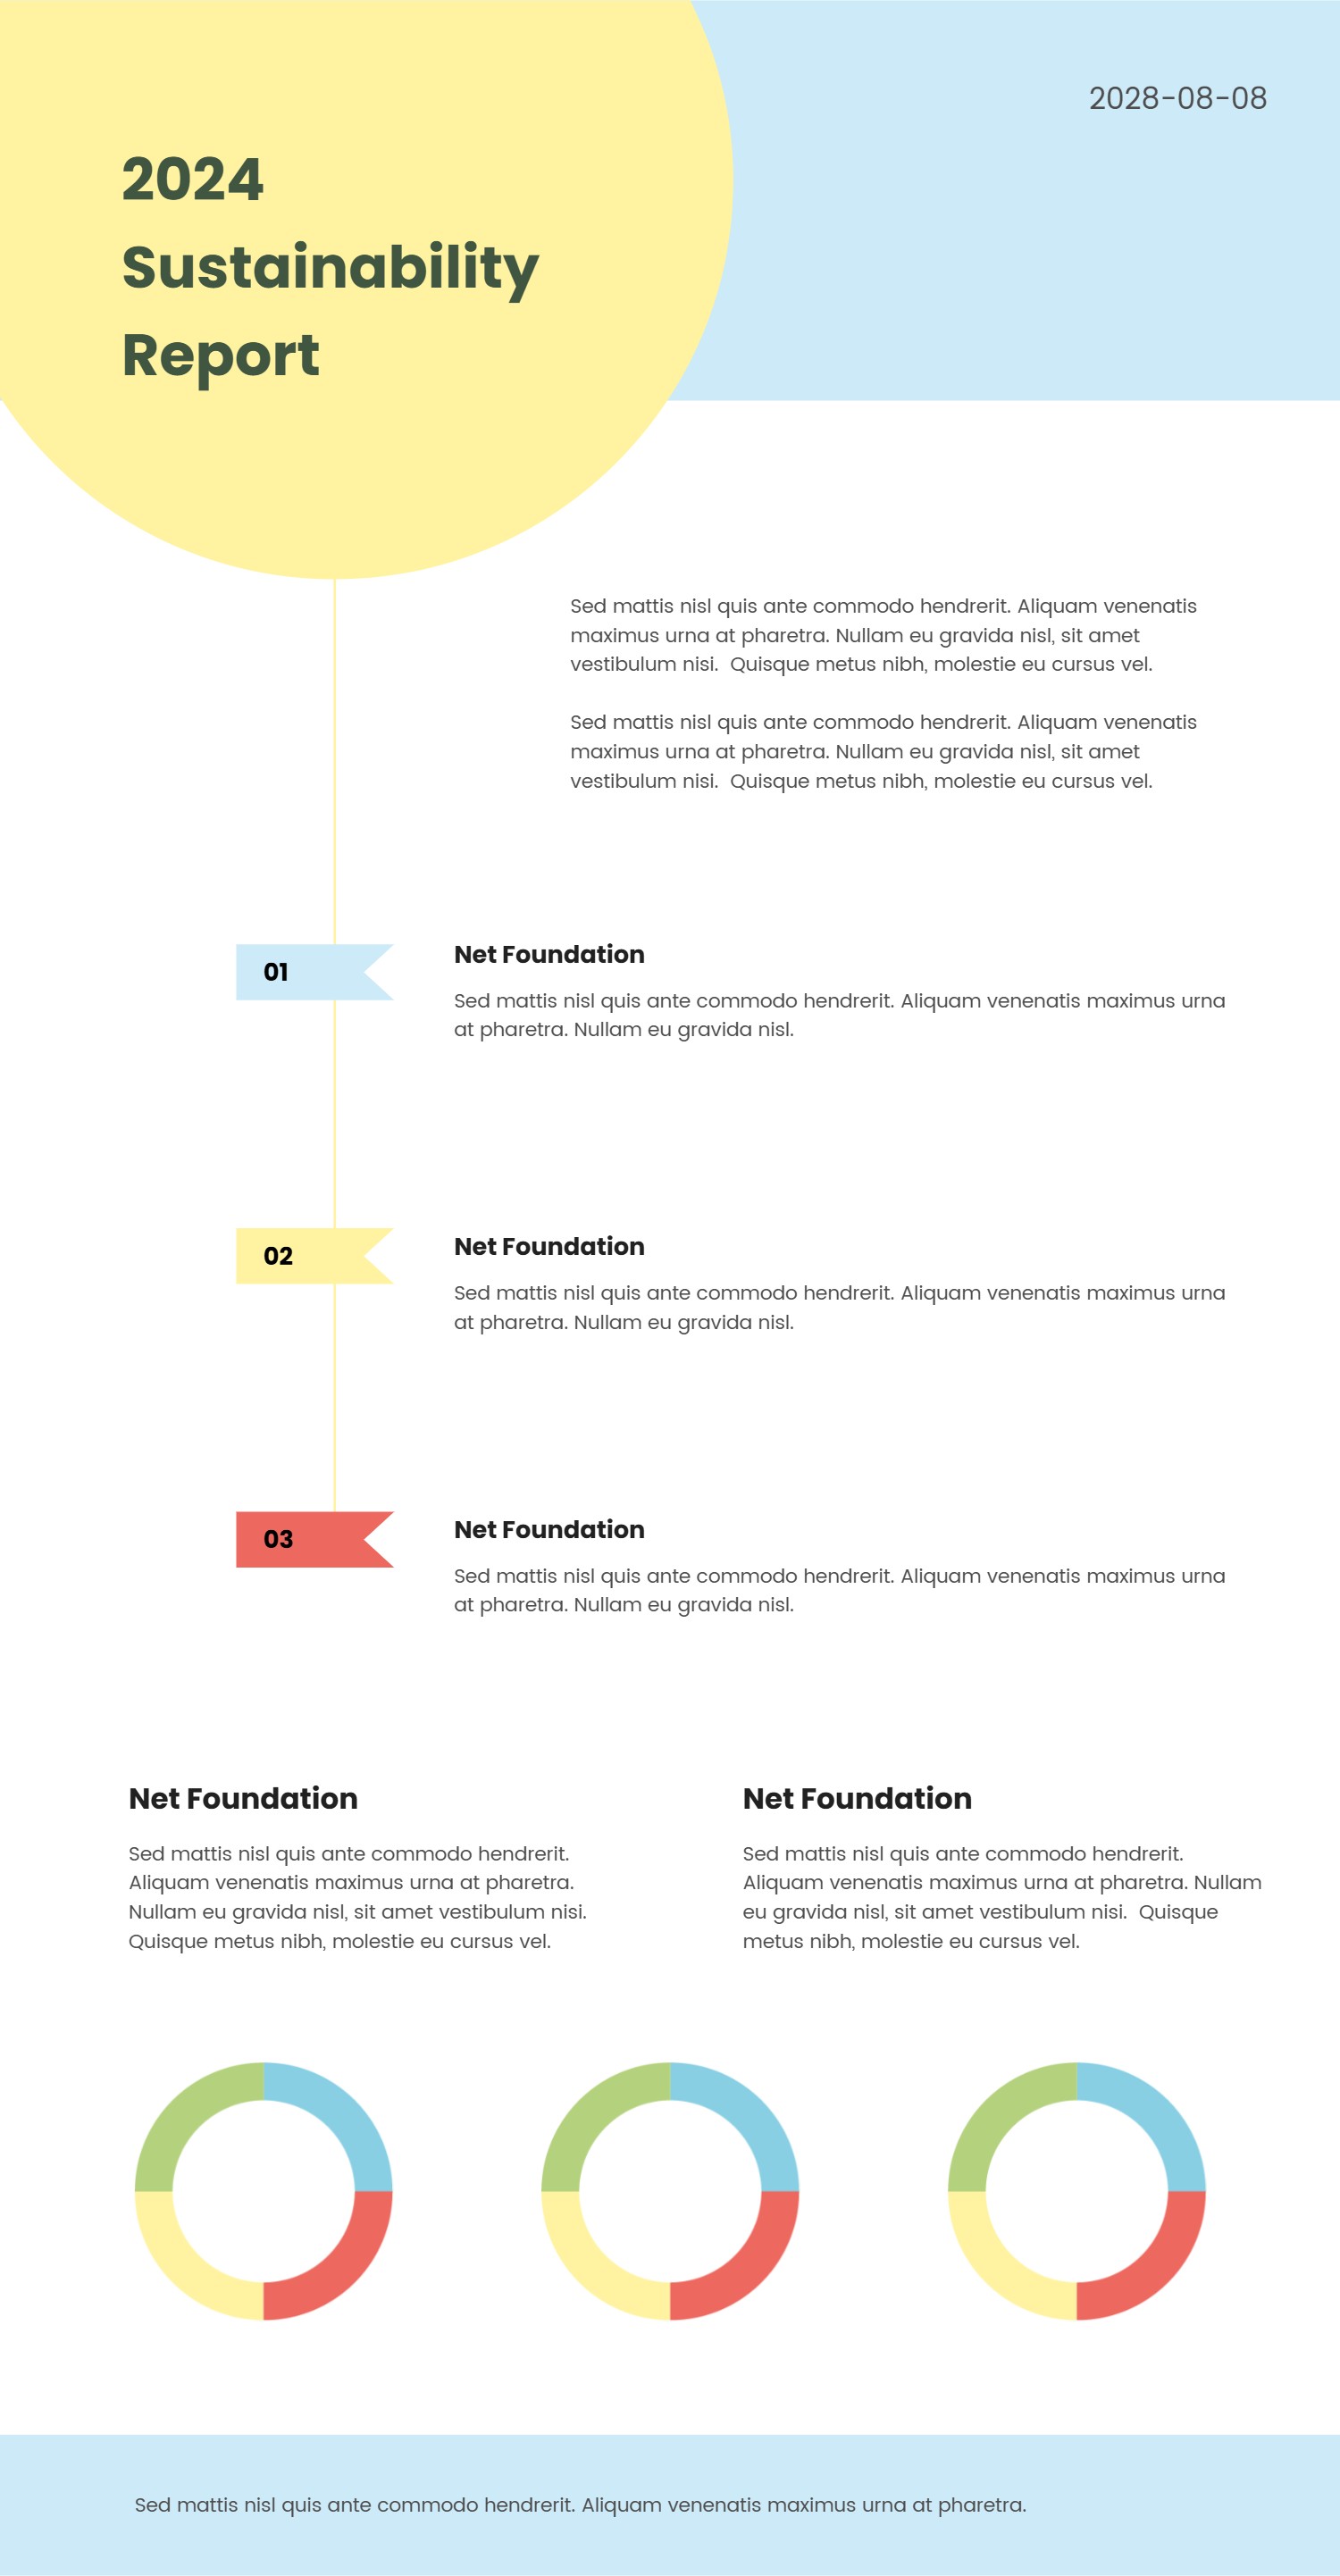
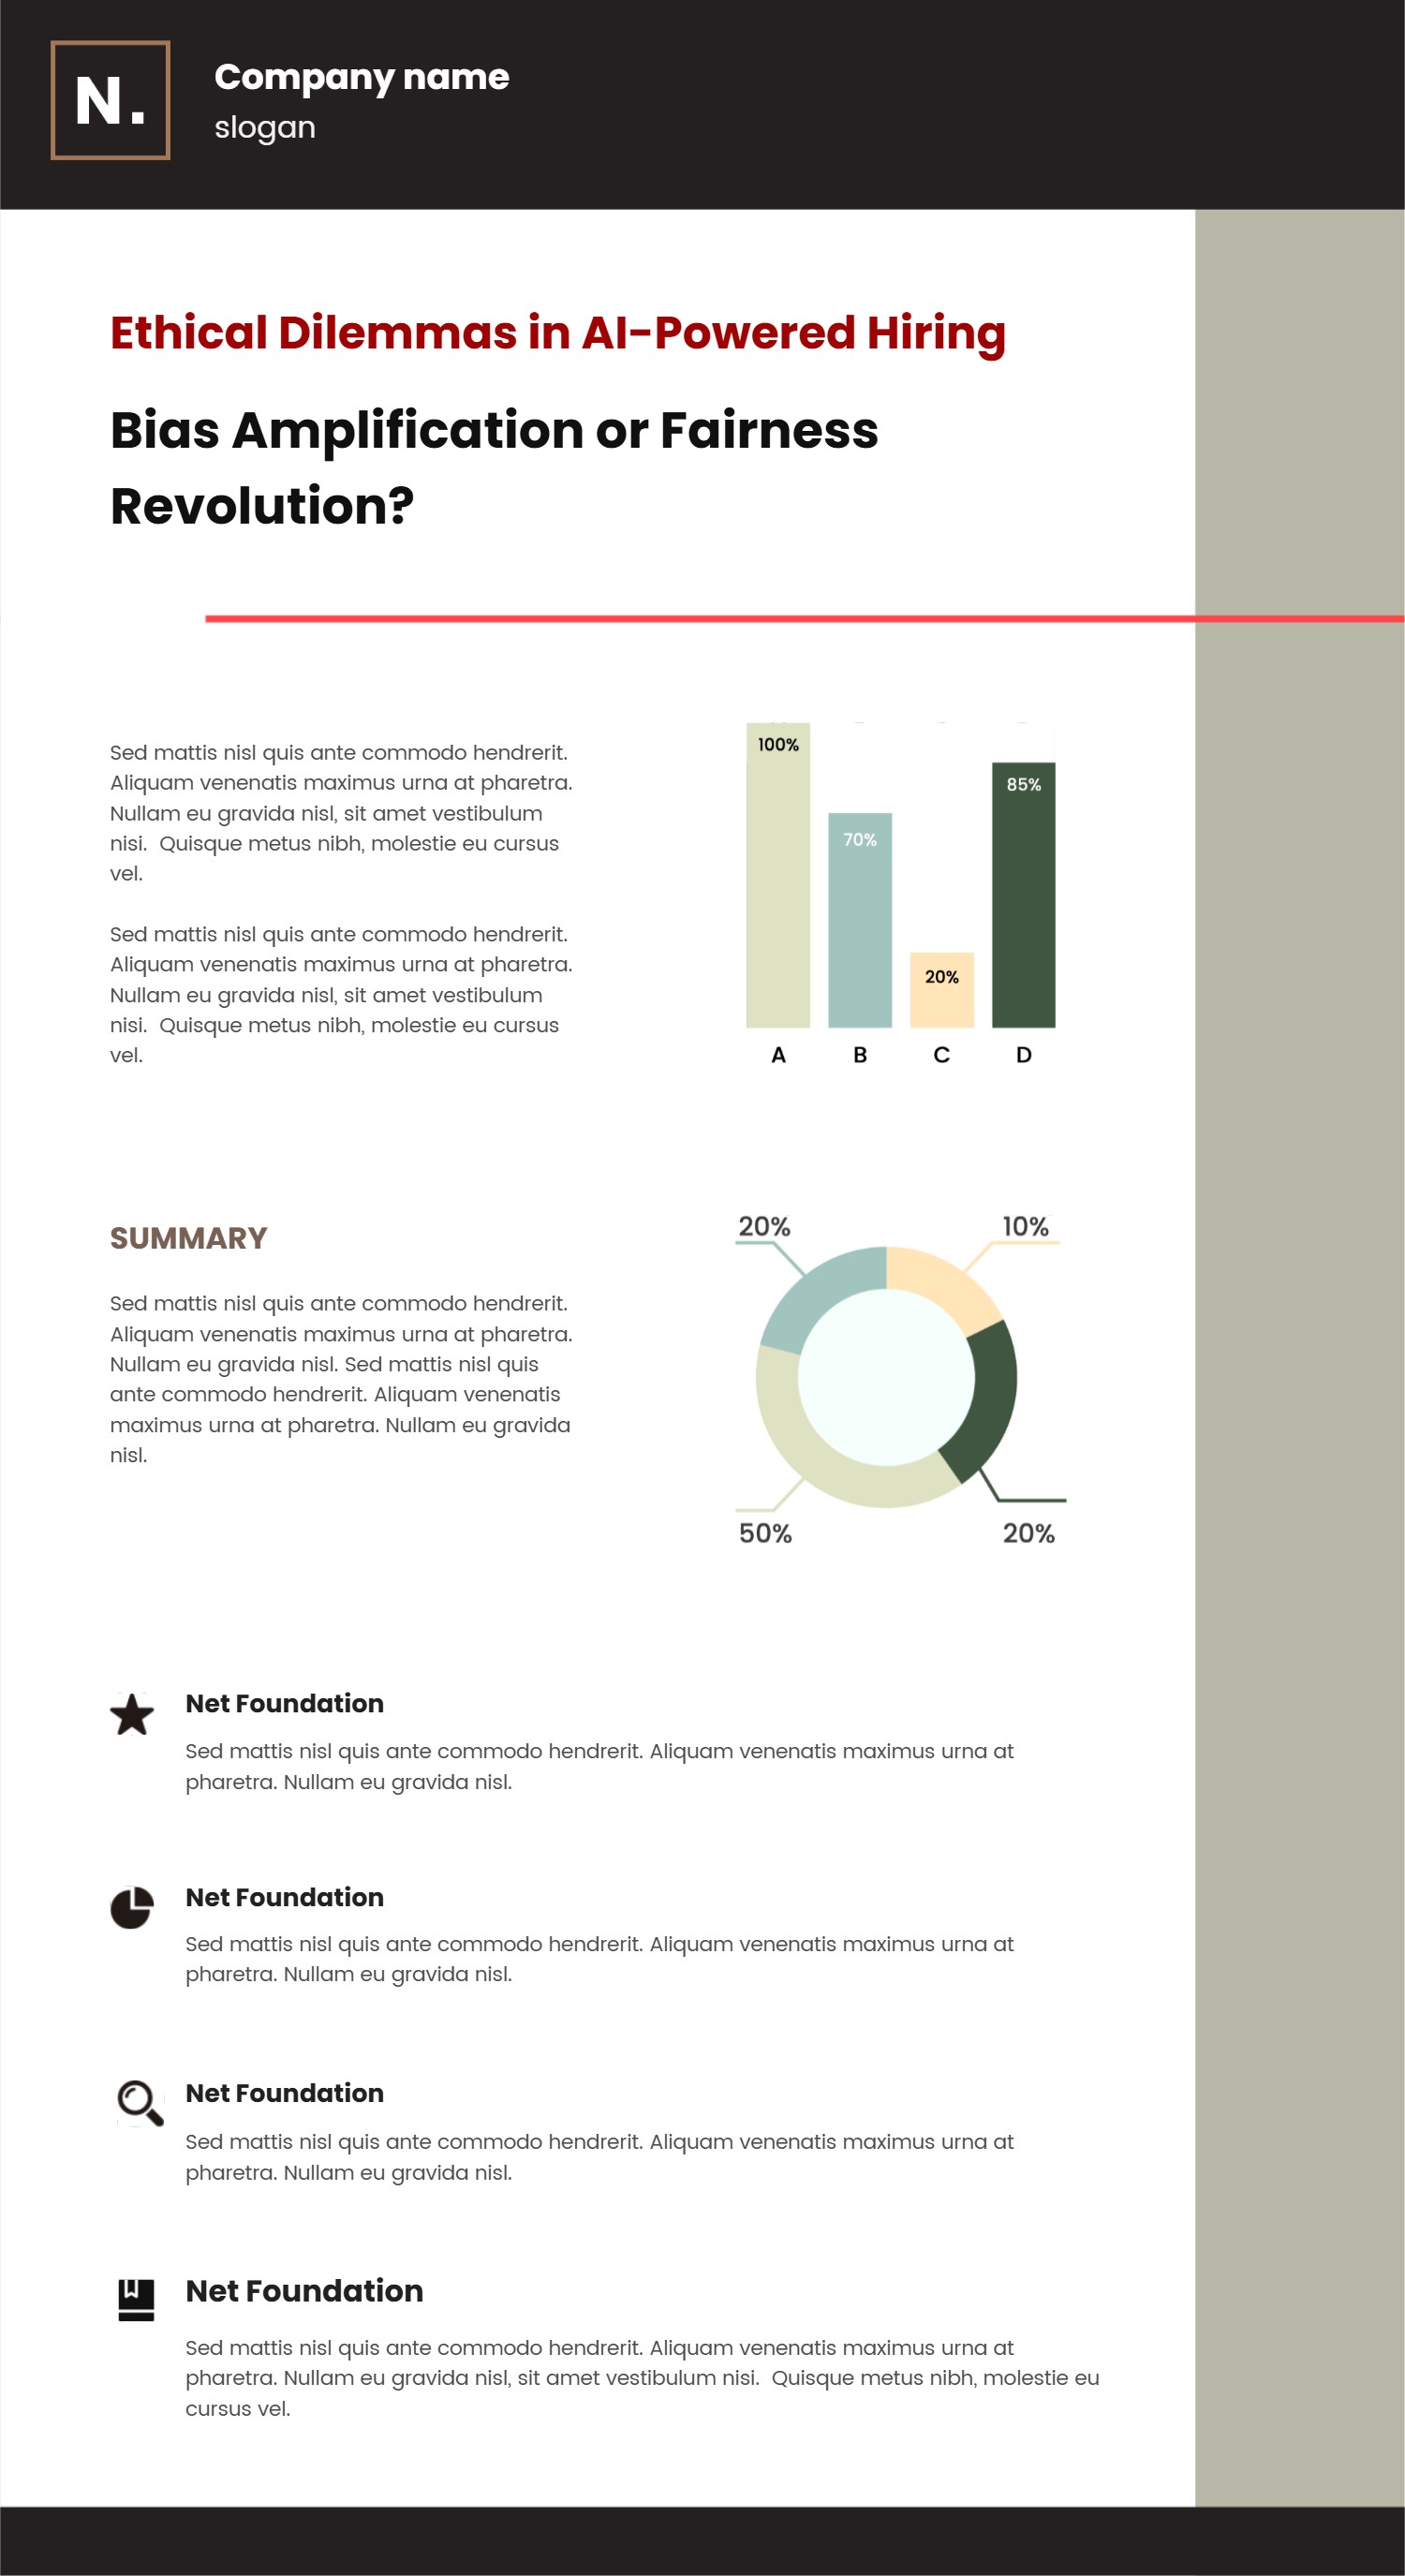
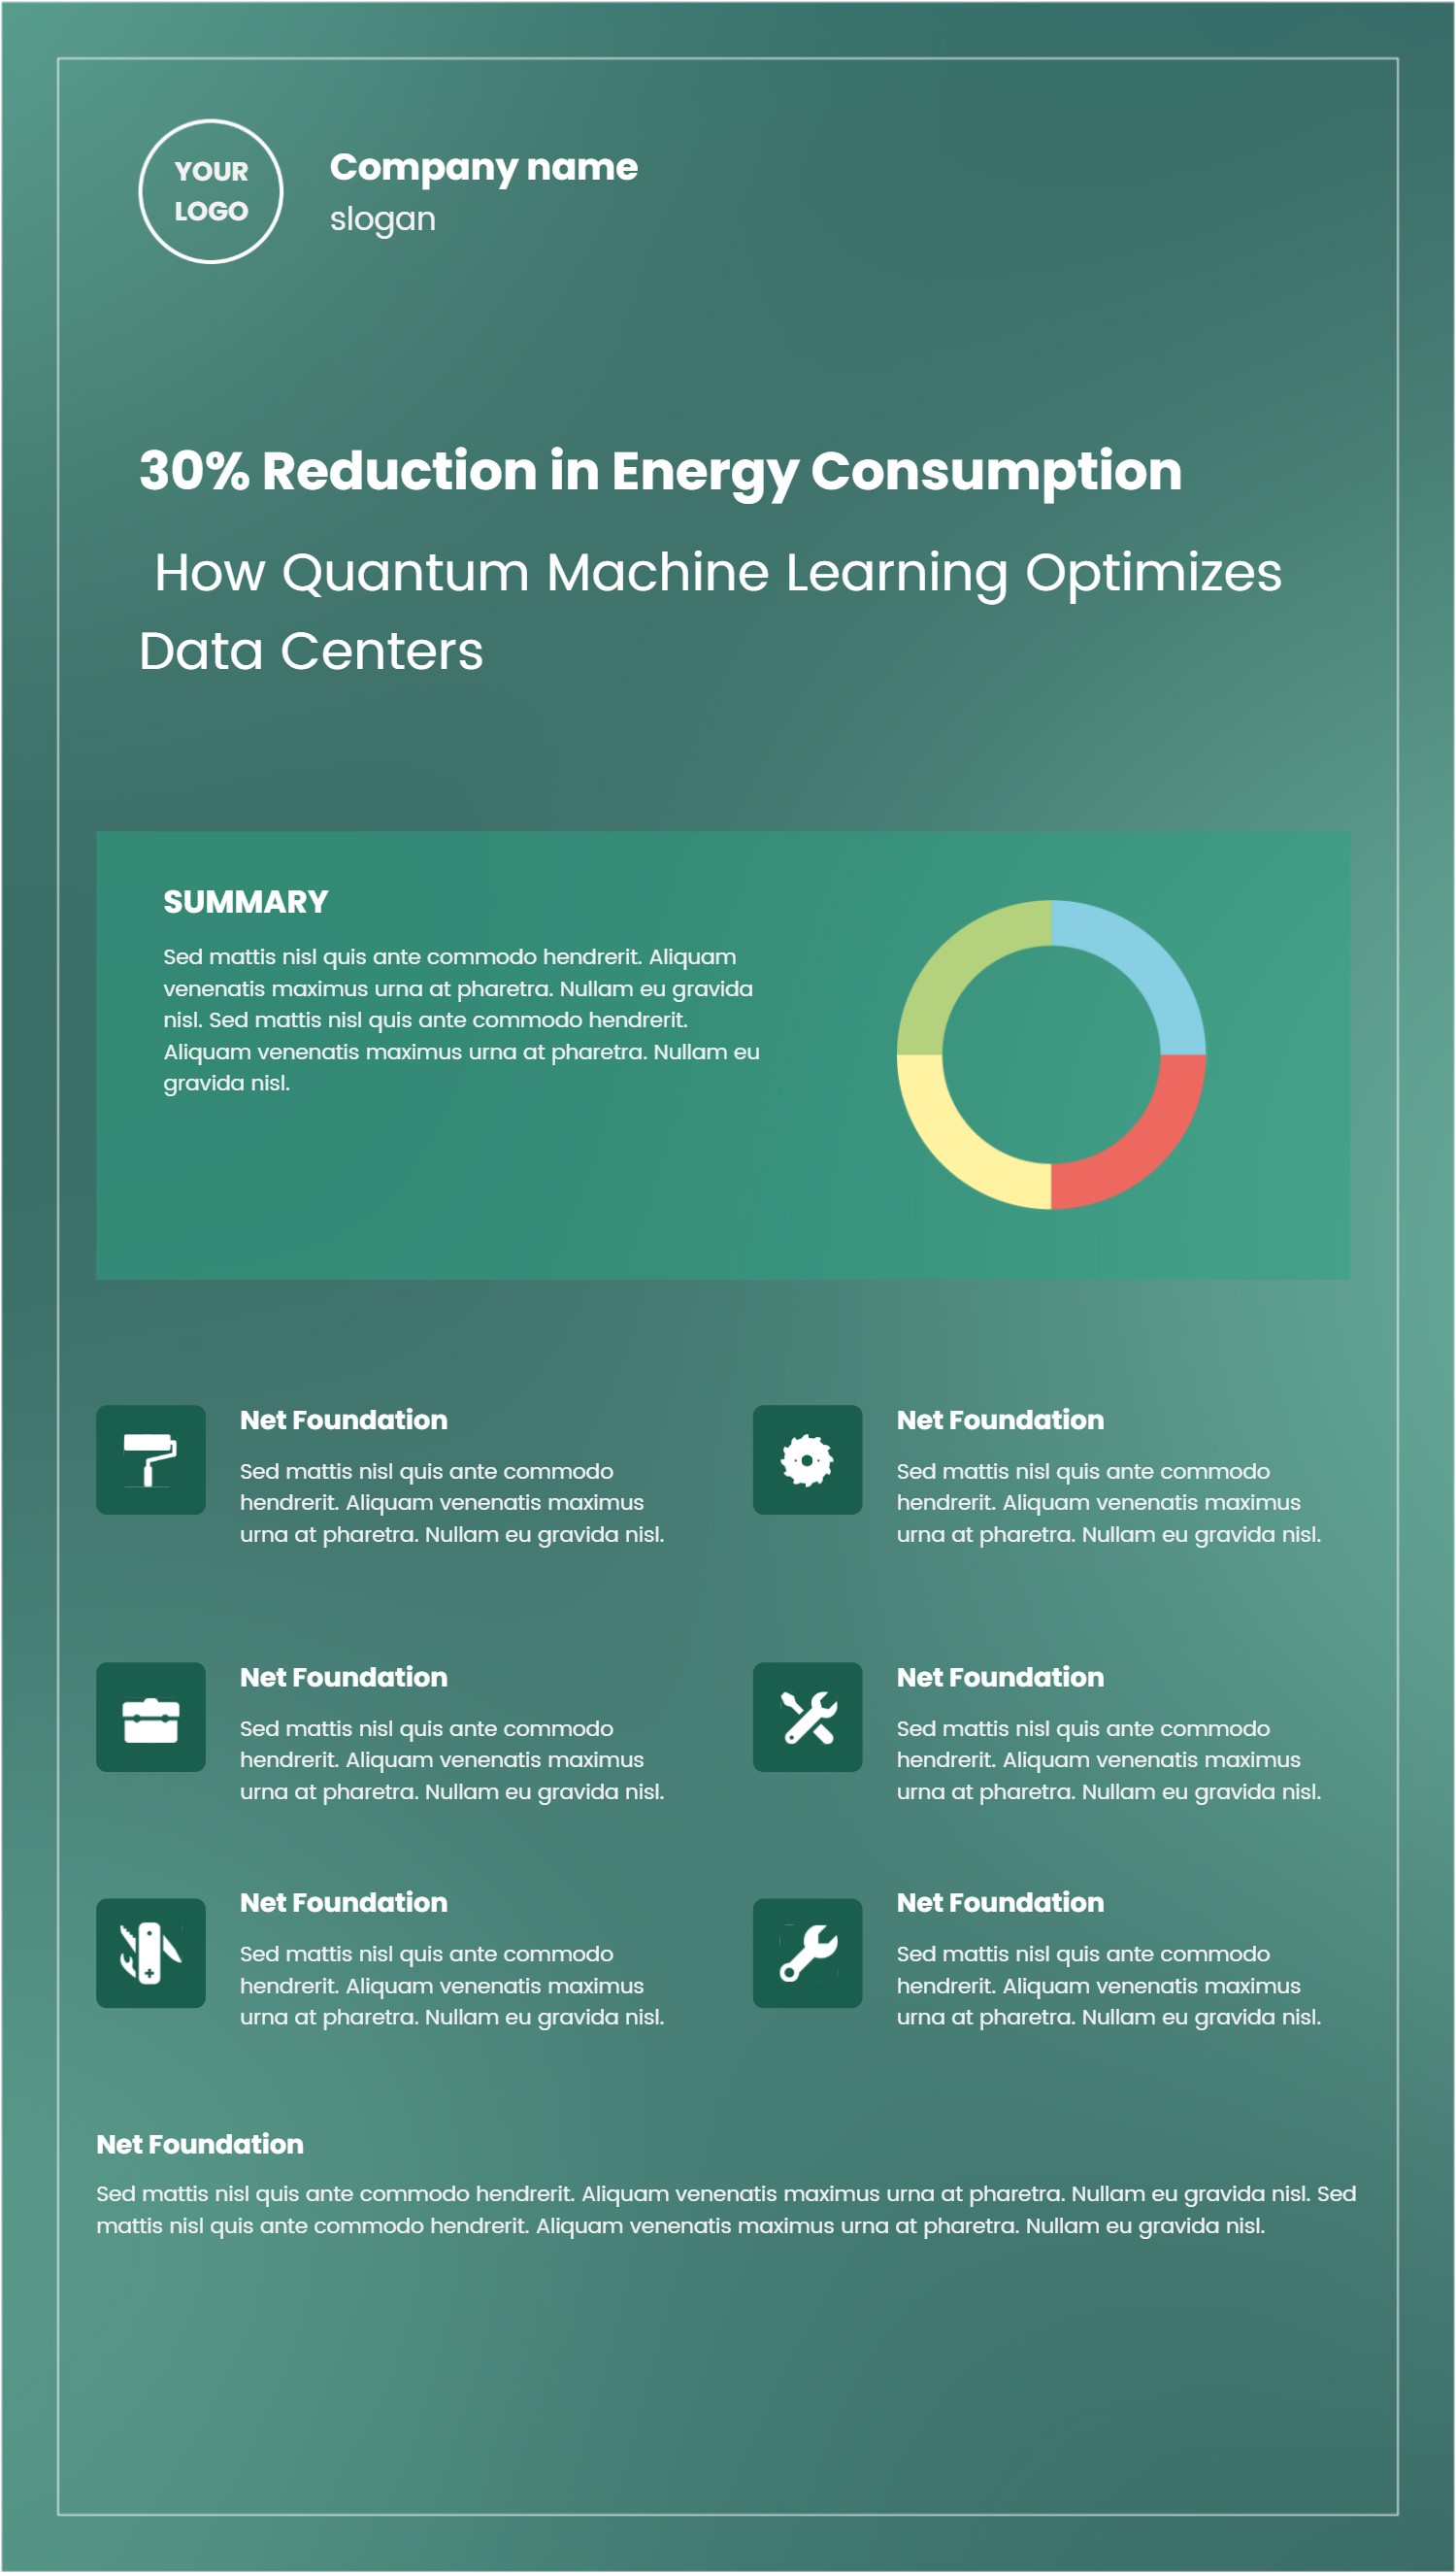
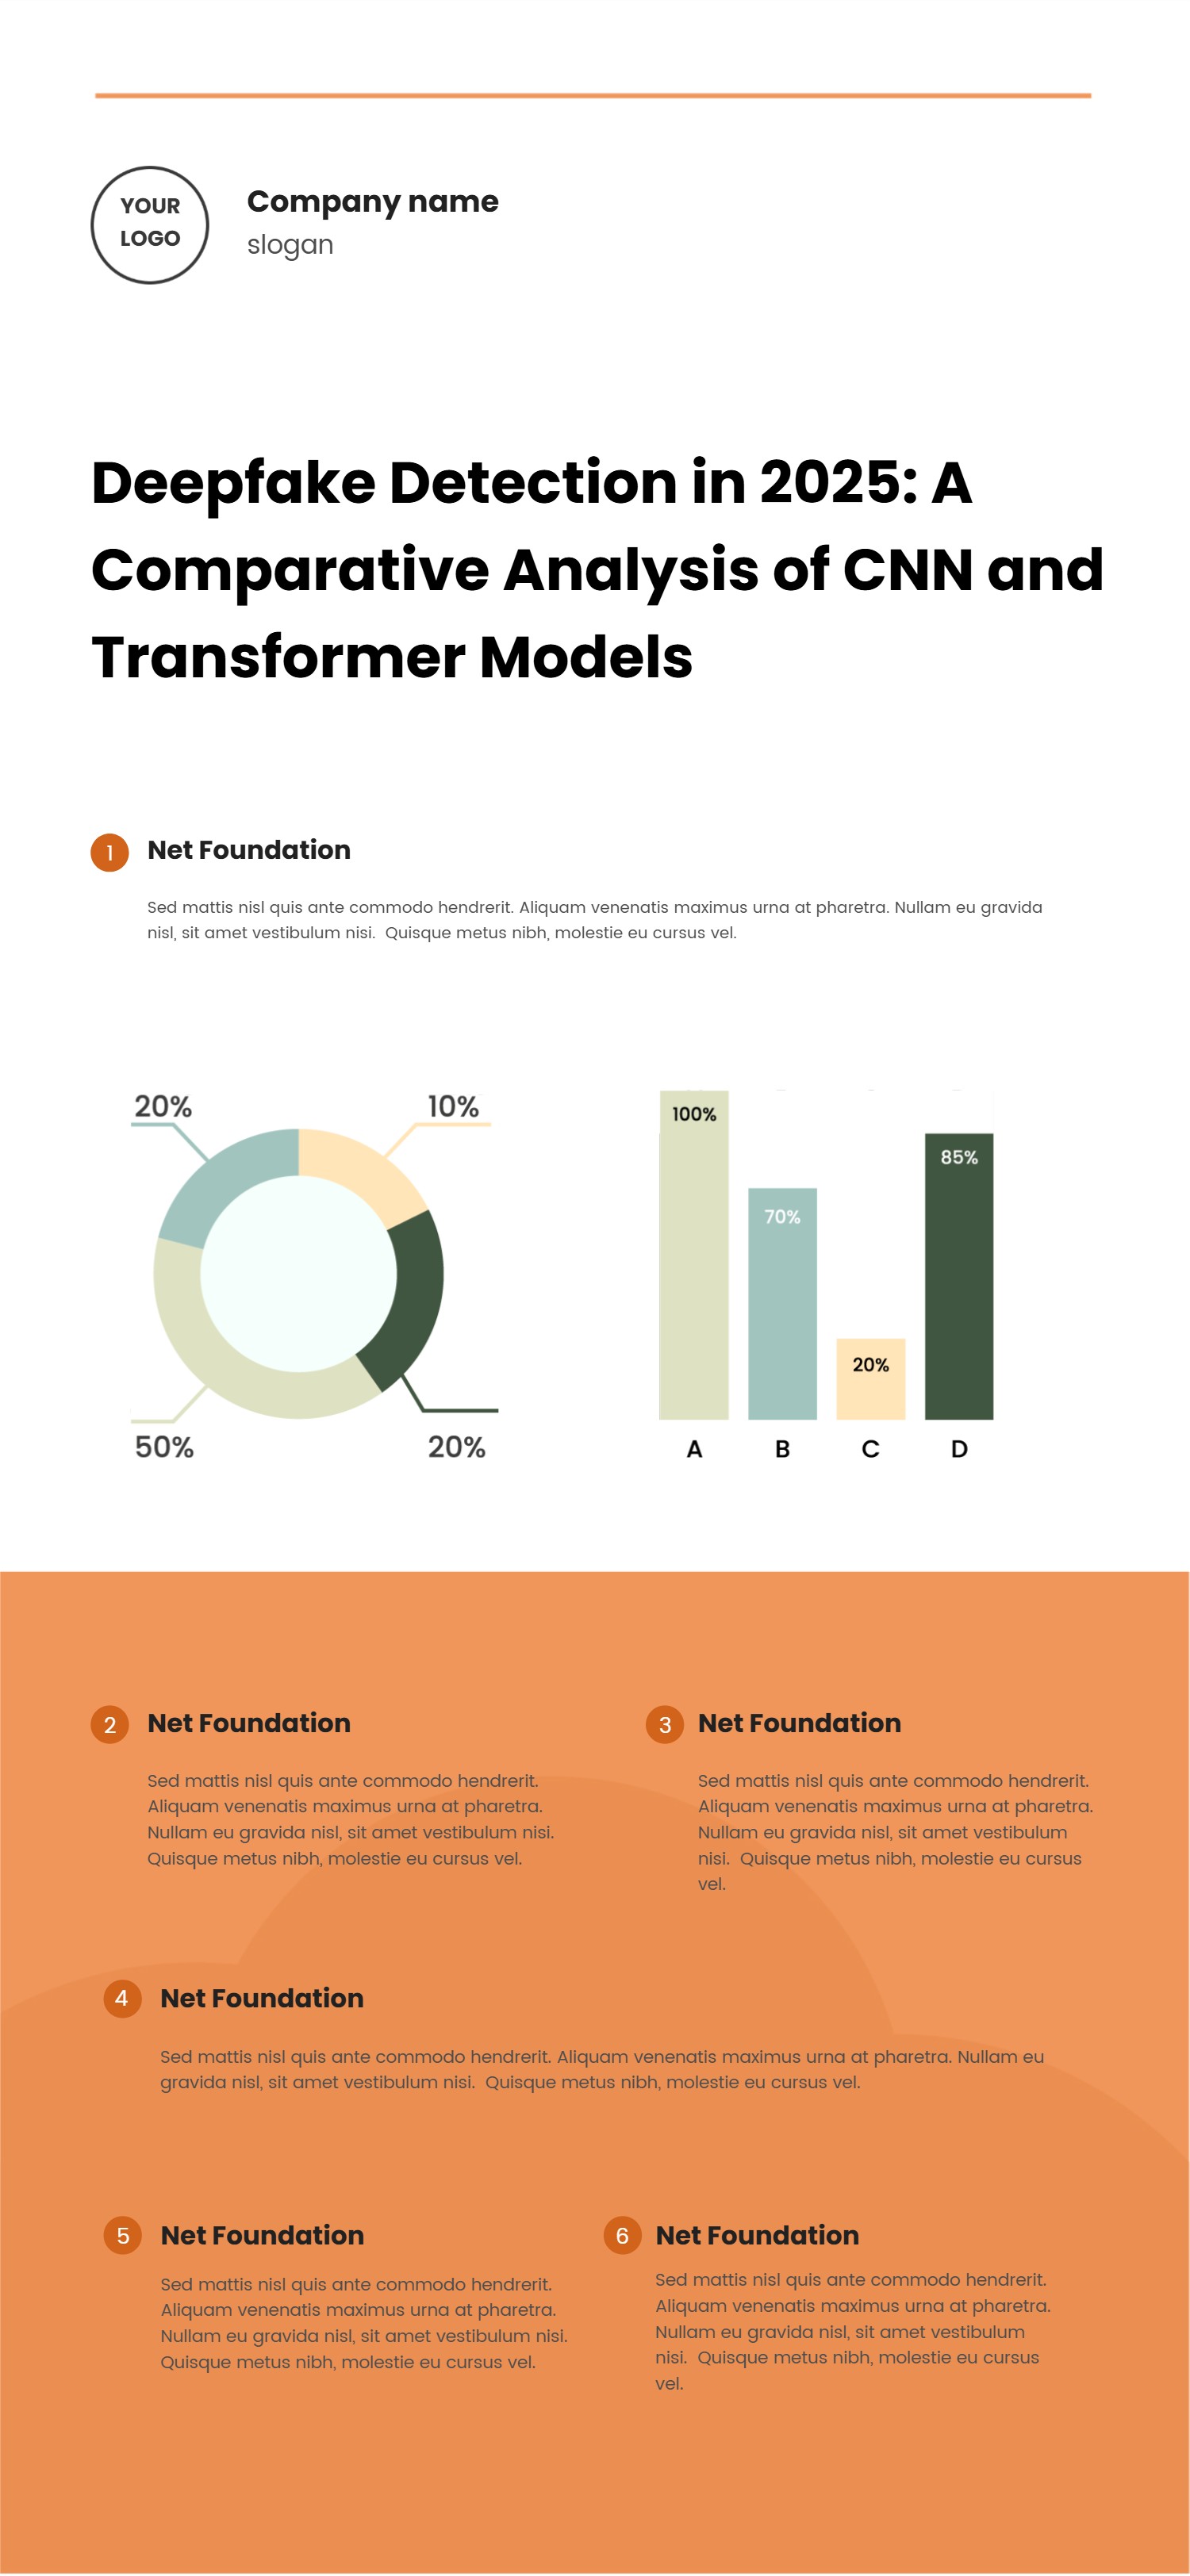
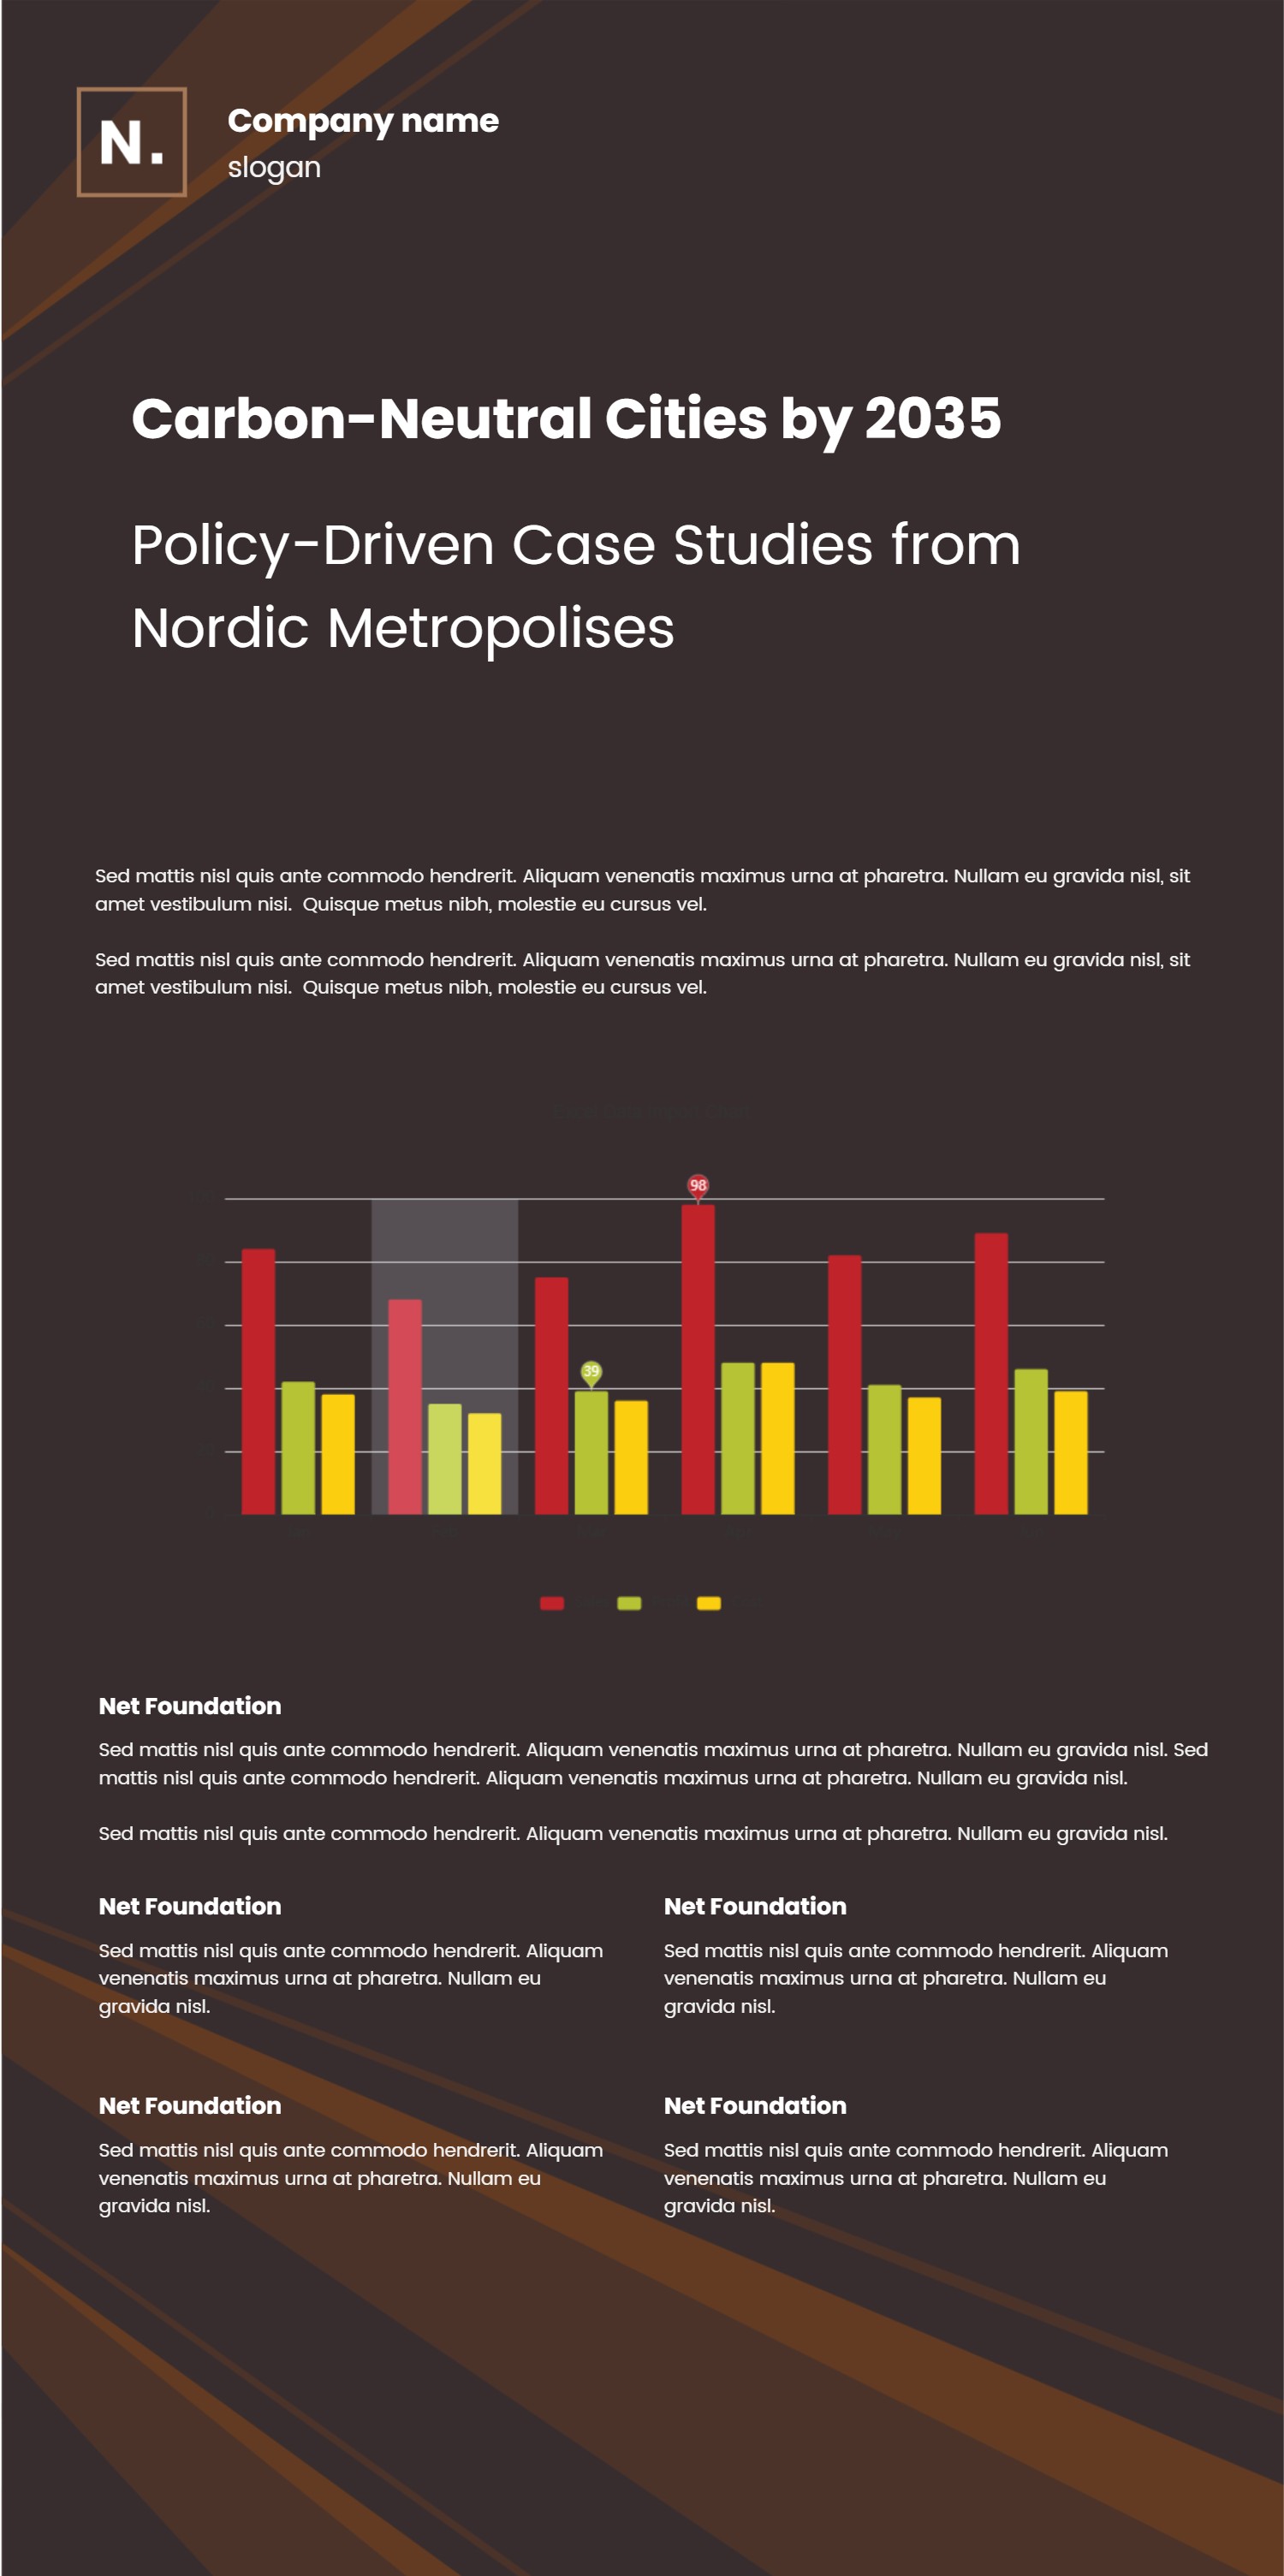
This vertical timeline pairs numbered steps with data highlights, making it a strong fit for PowerPoint when you need to show a process and supporting metrics. Each colored segment holds a heading and short paragraph, guiding the reader down the page in a clear sequence. The light palette and wide spacing keep the layout airy while still leaving room for charts on the side. Use it for quarterly plans, implementation paths, research summaries, or performance reviews where you want to connect actions with results. You can place milestones on the vertical spine and use the donut charts to show completion rates, budgets, or scorecards. Keep sentences simple so viewers can skim the flow and the numbers at the same time. The design works for printouts as well because the contrast stays readable on white paper. If you need to share online, export as a PNG and the vertical shape will still fit mobile screens. Add small callouts for owners or due dates without crowding the steps. To build it quickly, open the AI generator on the home page, choose this vertical timeline template, enter a prompt that lists your steps, key metrics, and tone, and let the tool deliver a ready-to-use infographic.