Premiere Pro MOGRT Infographic Charts Template

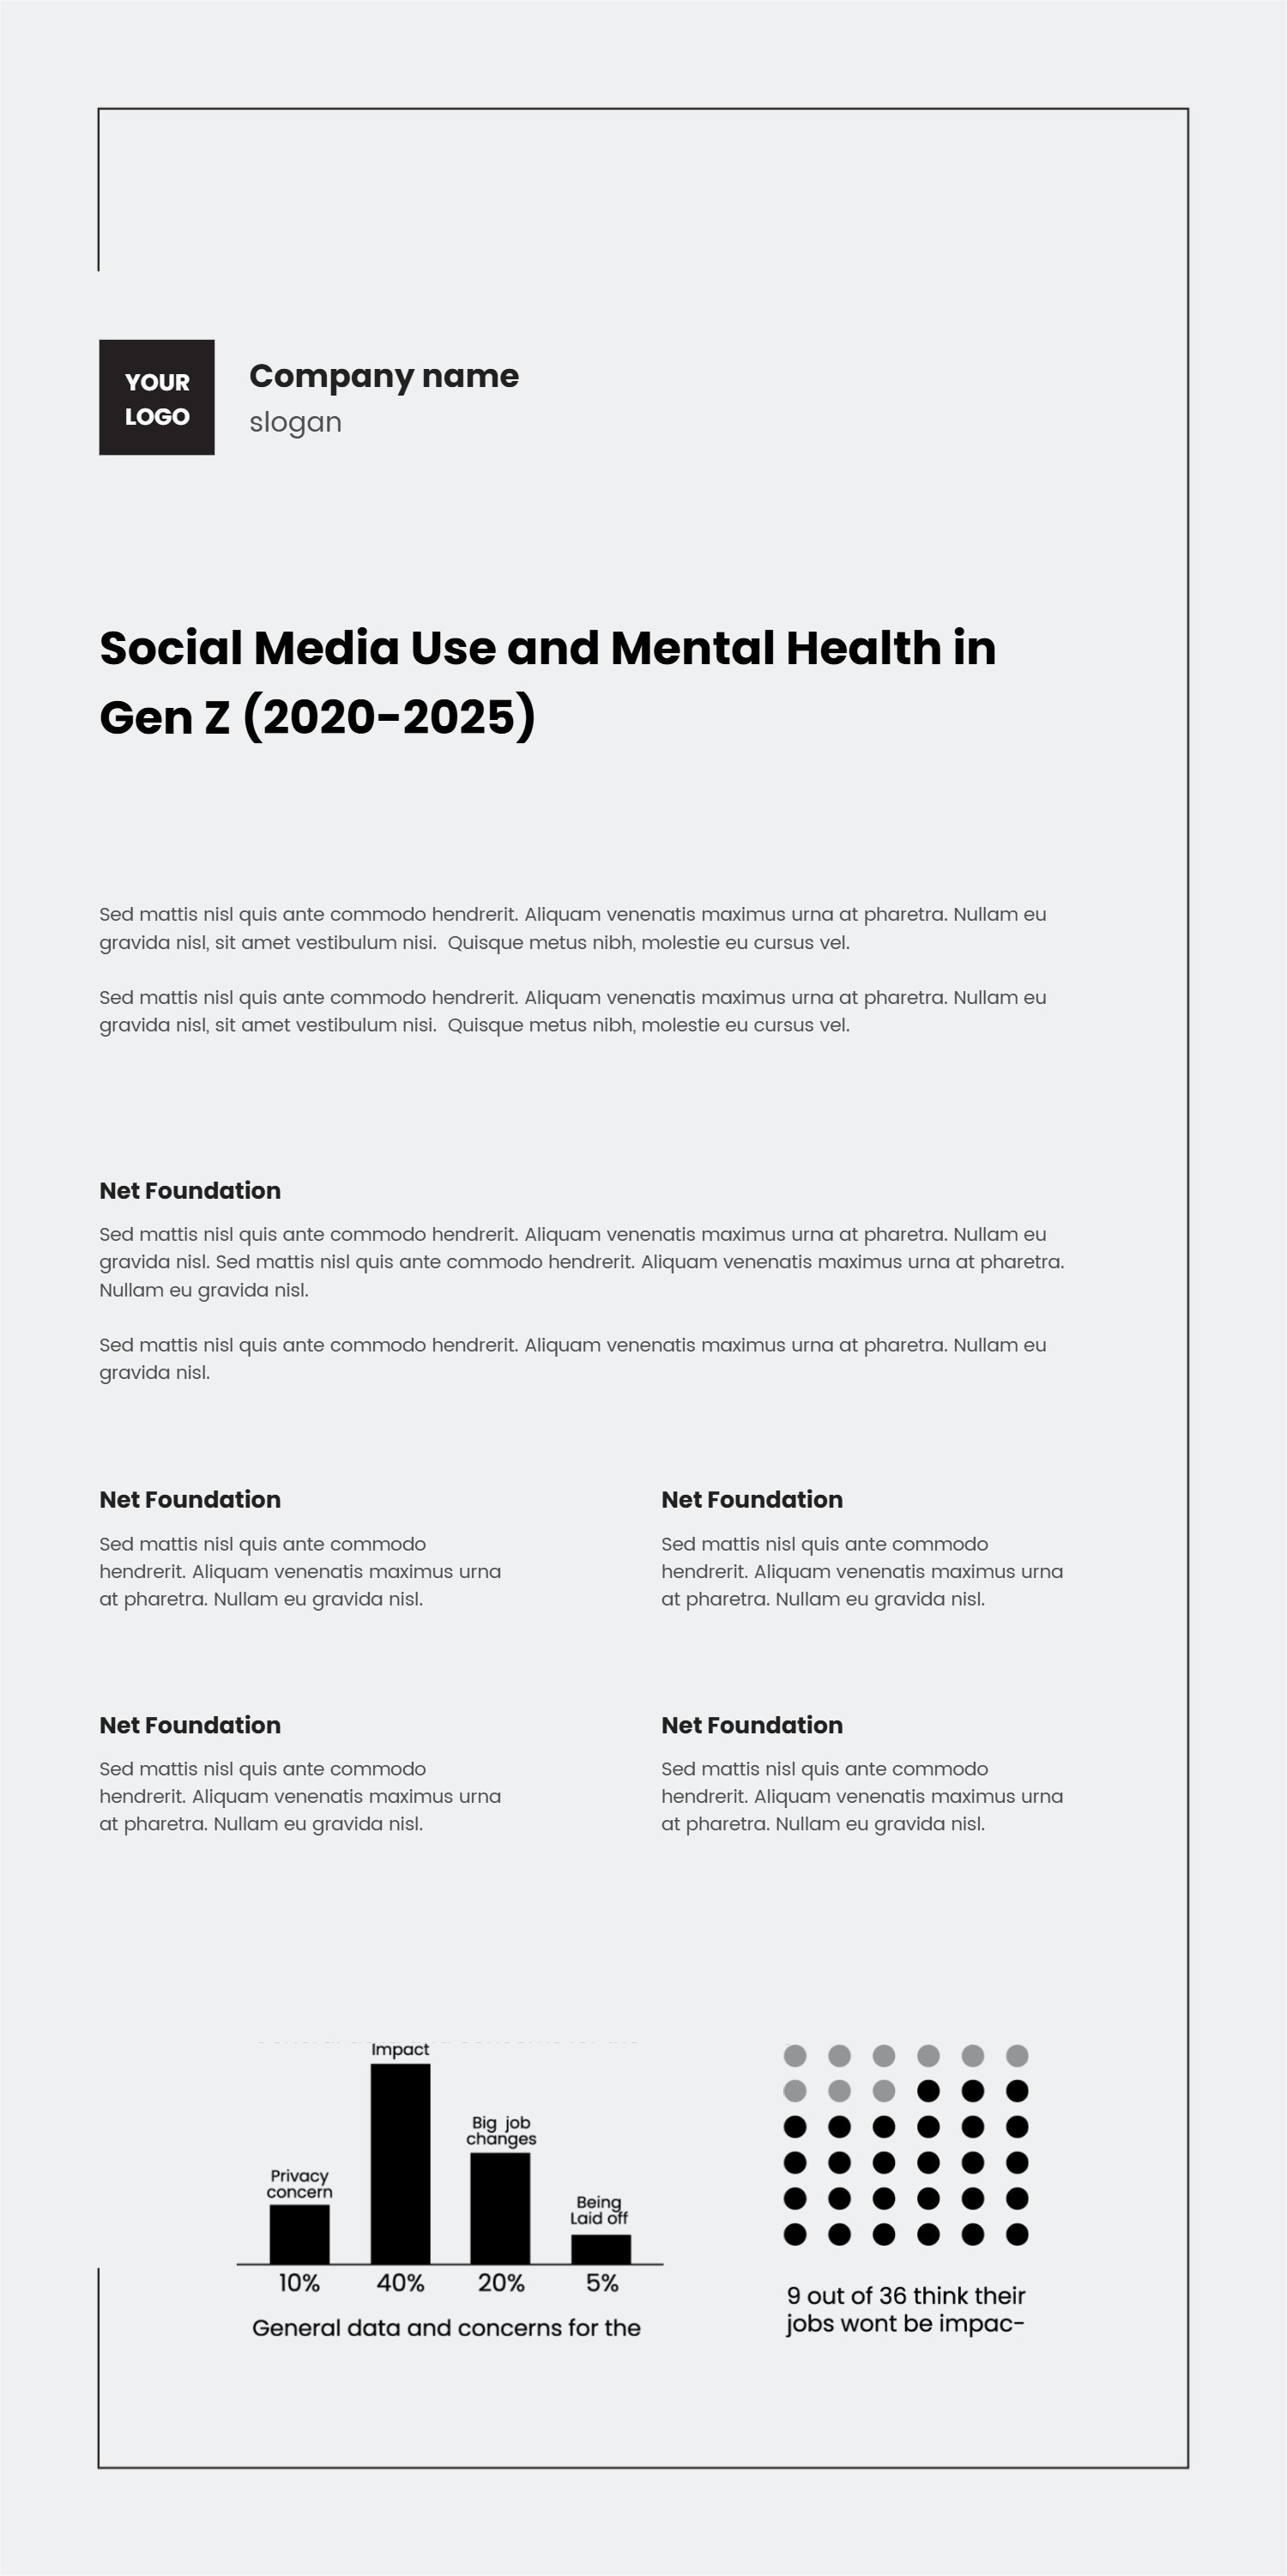
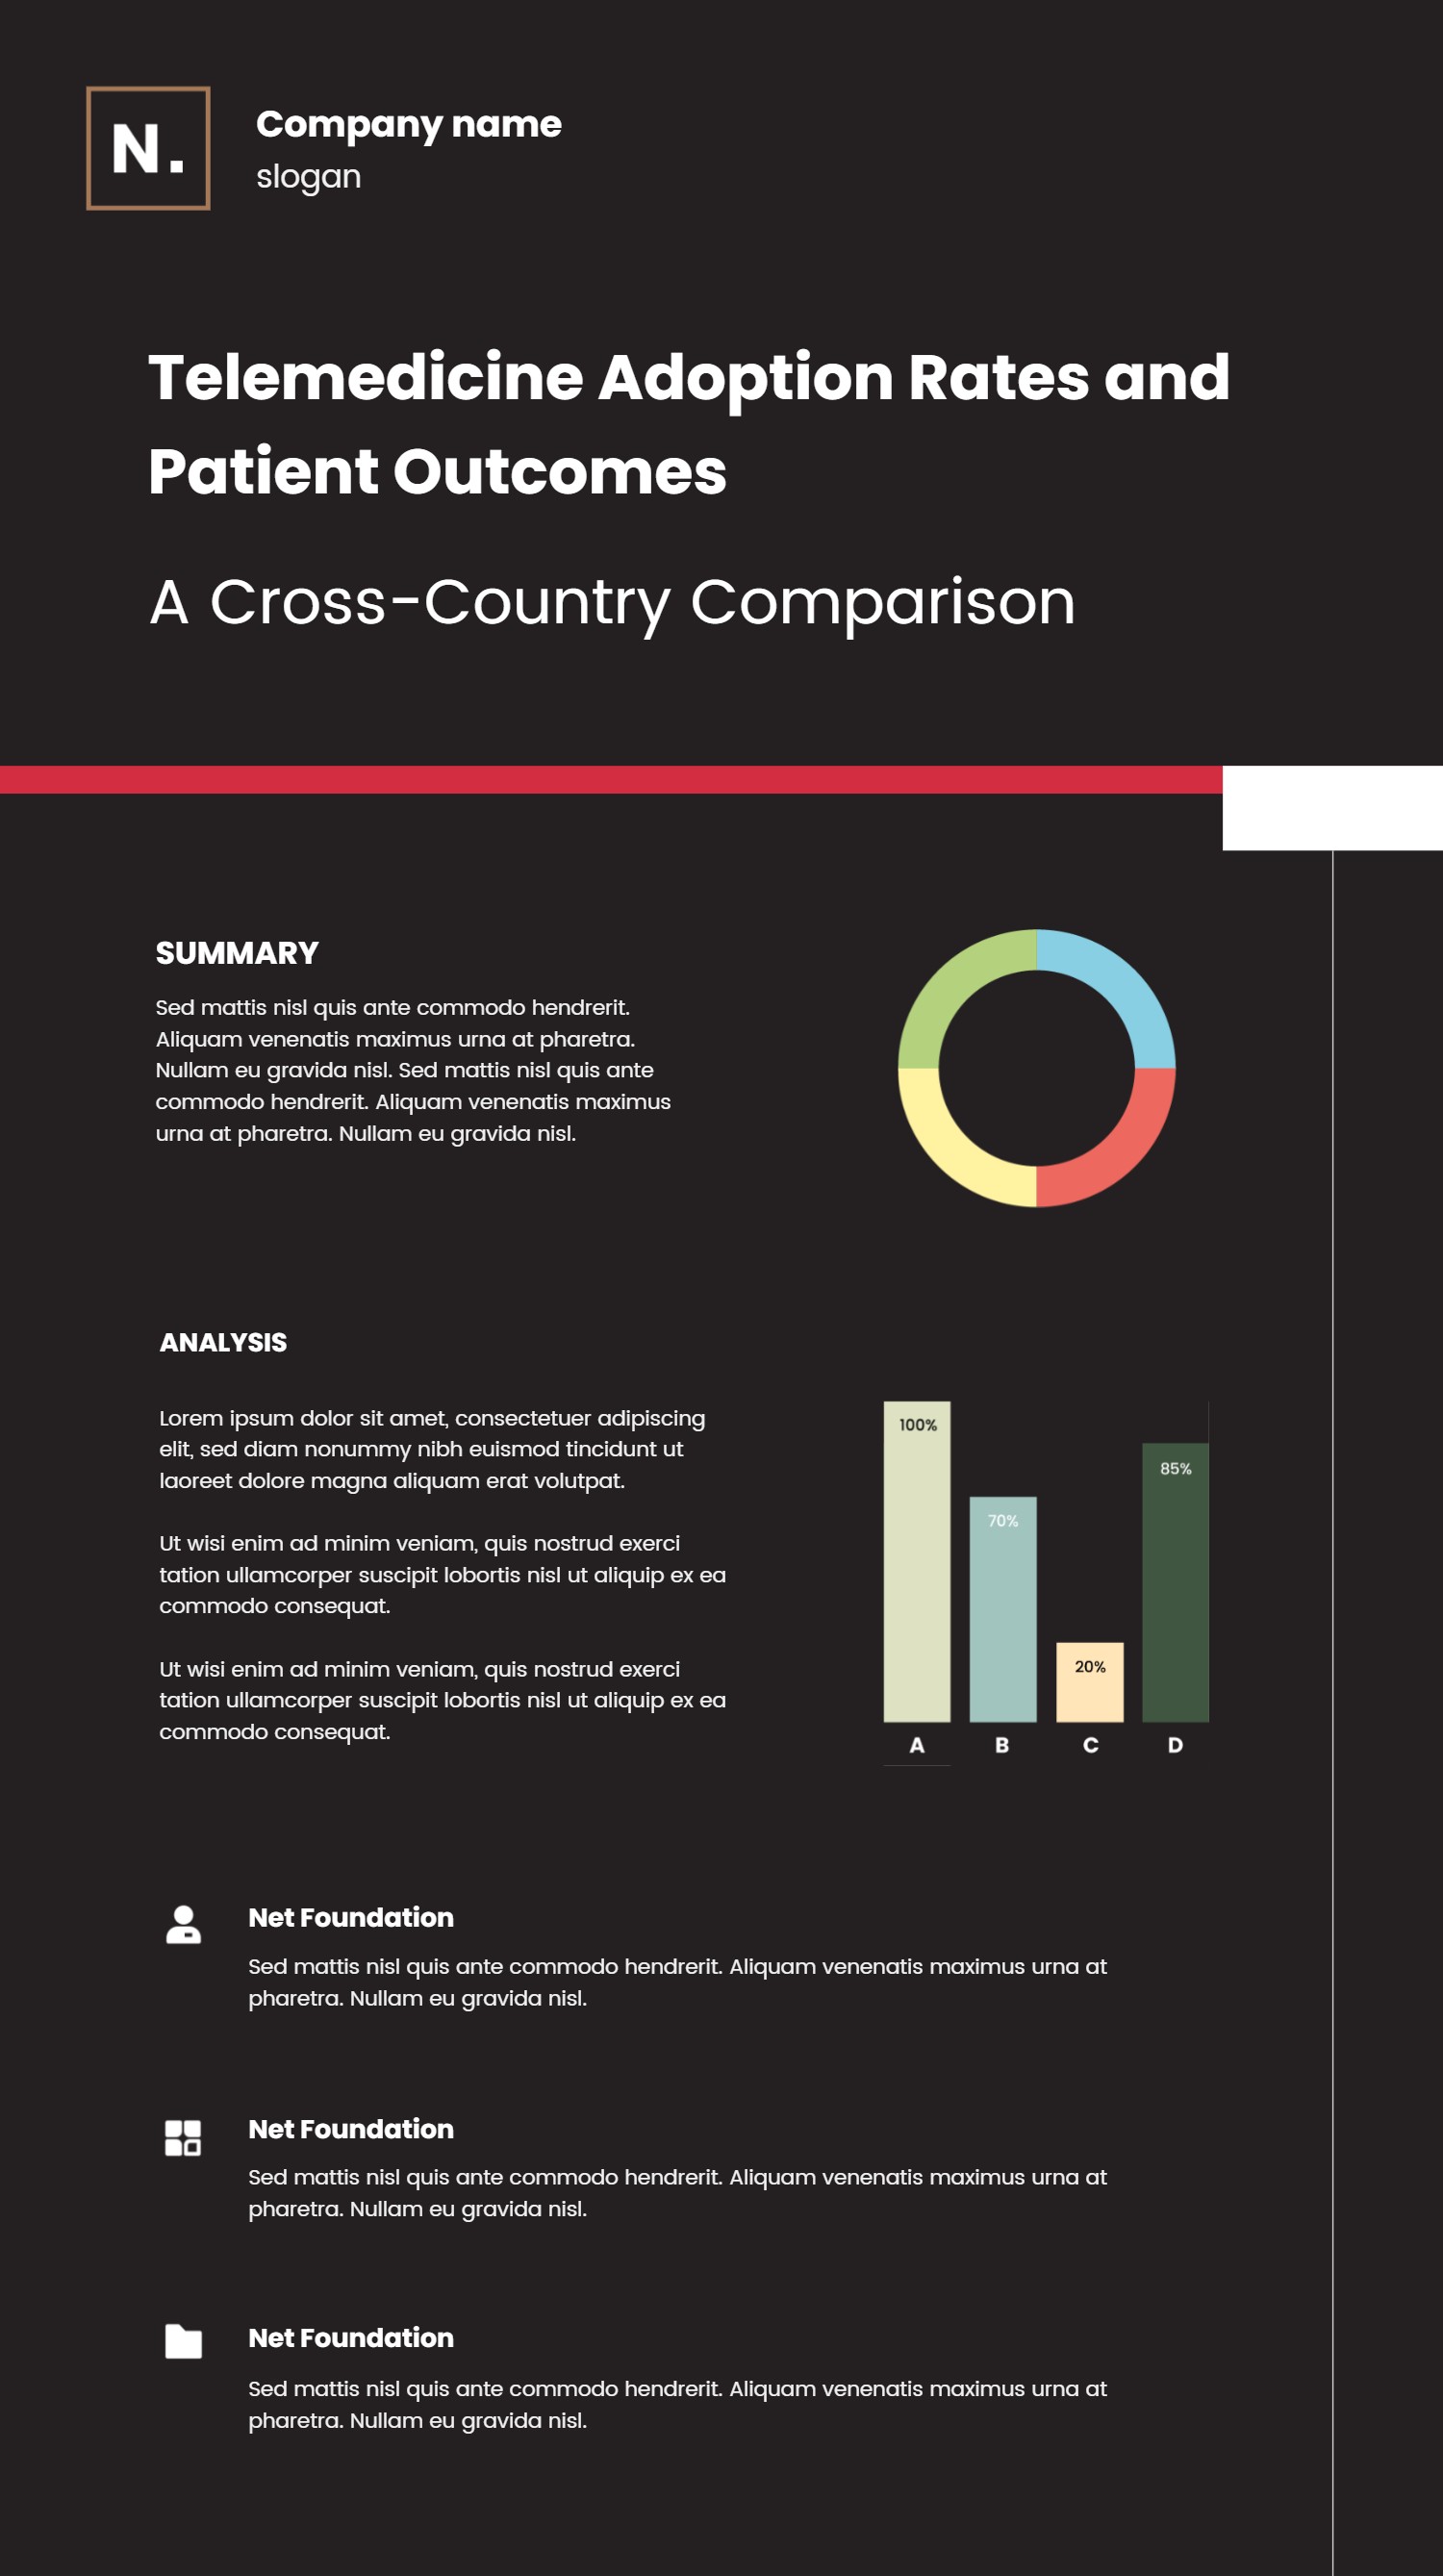
This infographic charts template suits Premiere Pro editors who want a MOGRT-style set of visuals. It combines simple charts, number badges, and text boxes you can drop into report videos, updates, or explainers. The layout keeps data in clear sections so viewers spot the key numbers without effort. Use it for KPIs, launch milestones, survey results, training recaps, or weekly status clips.
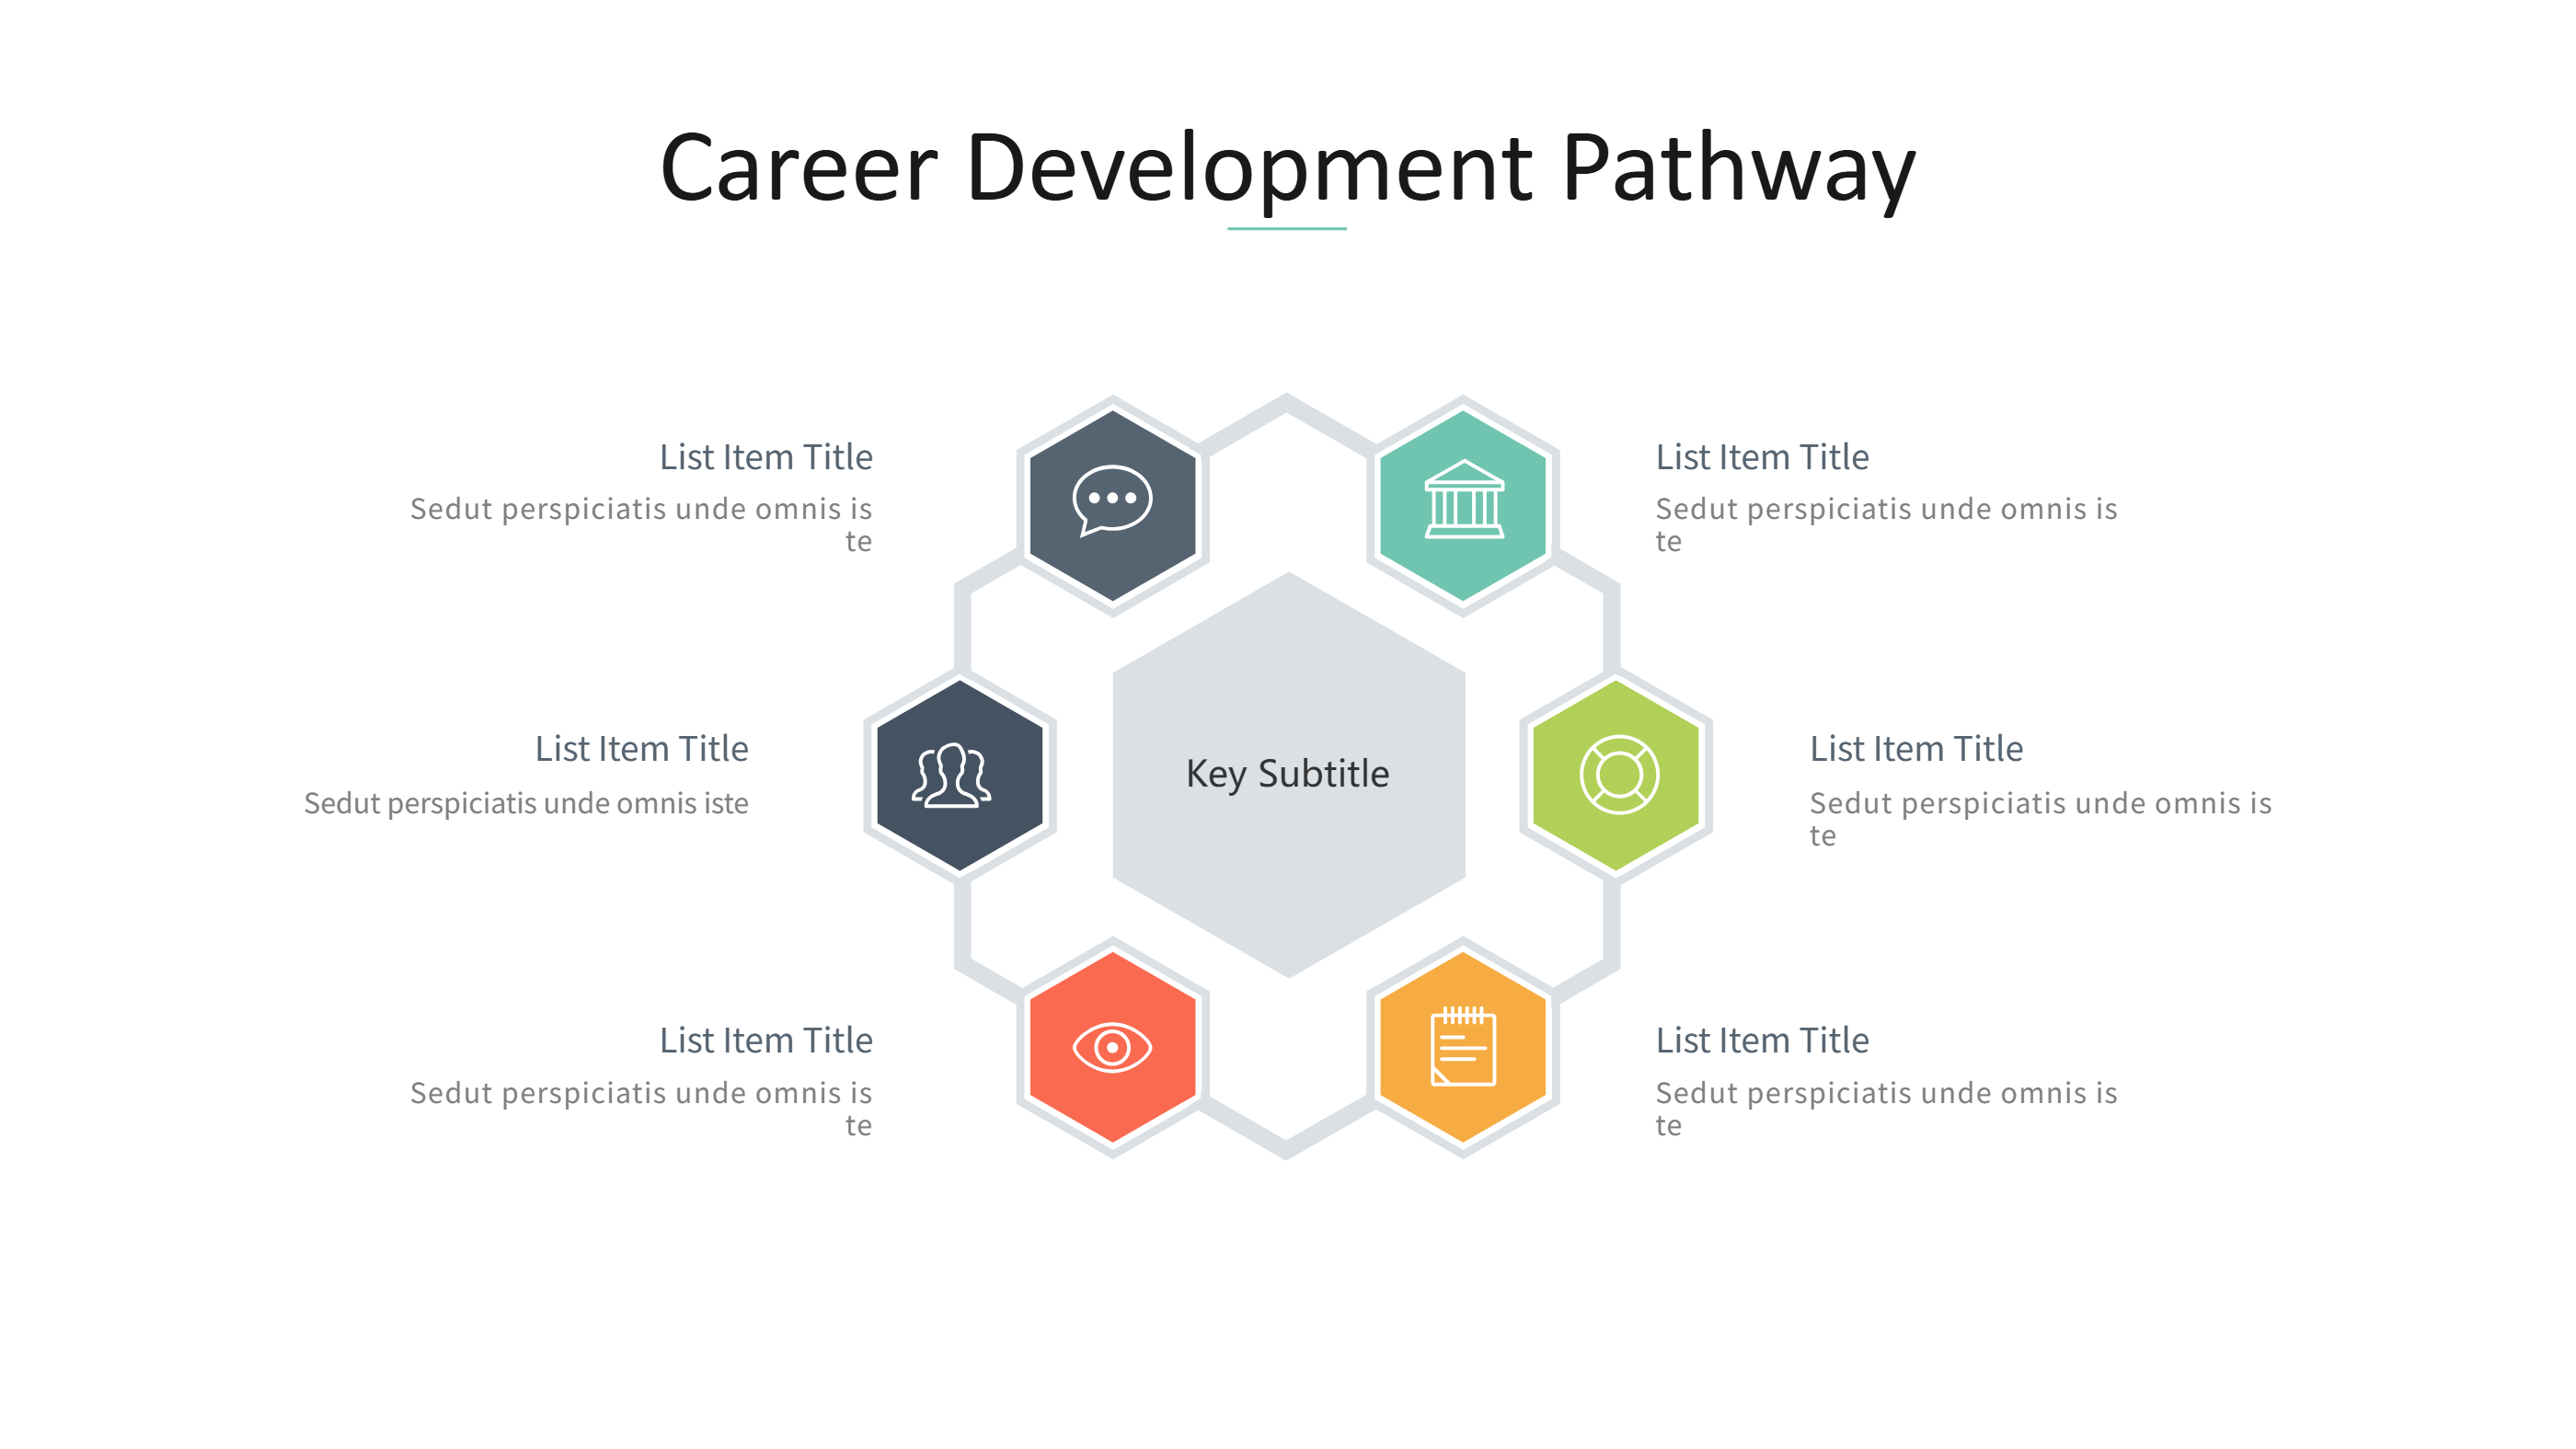
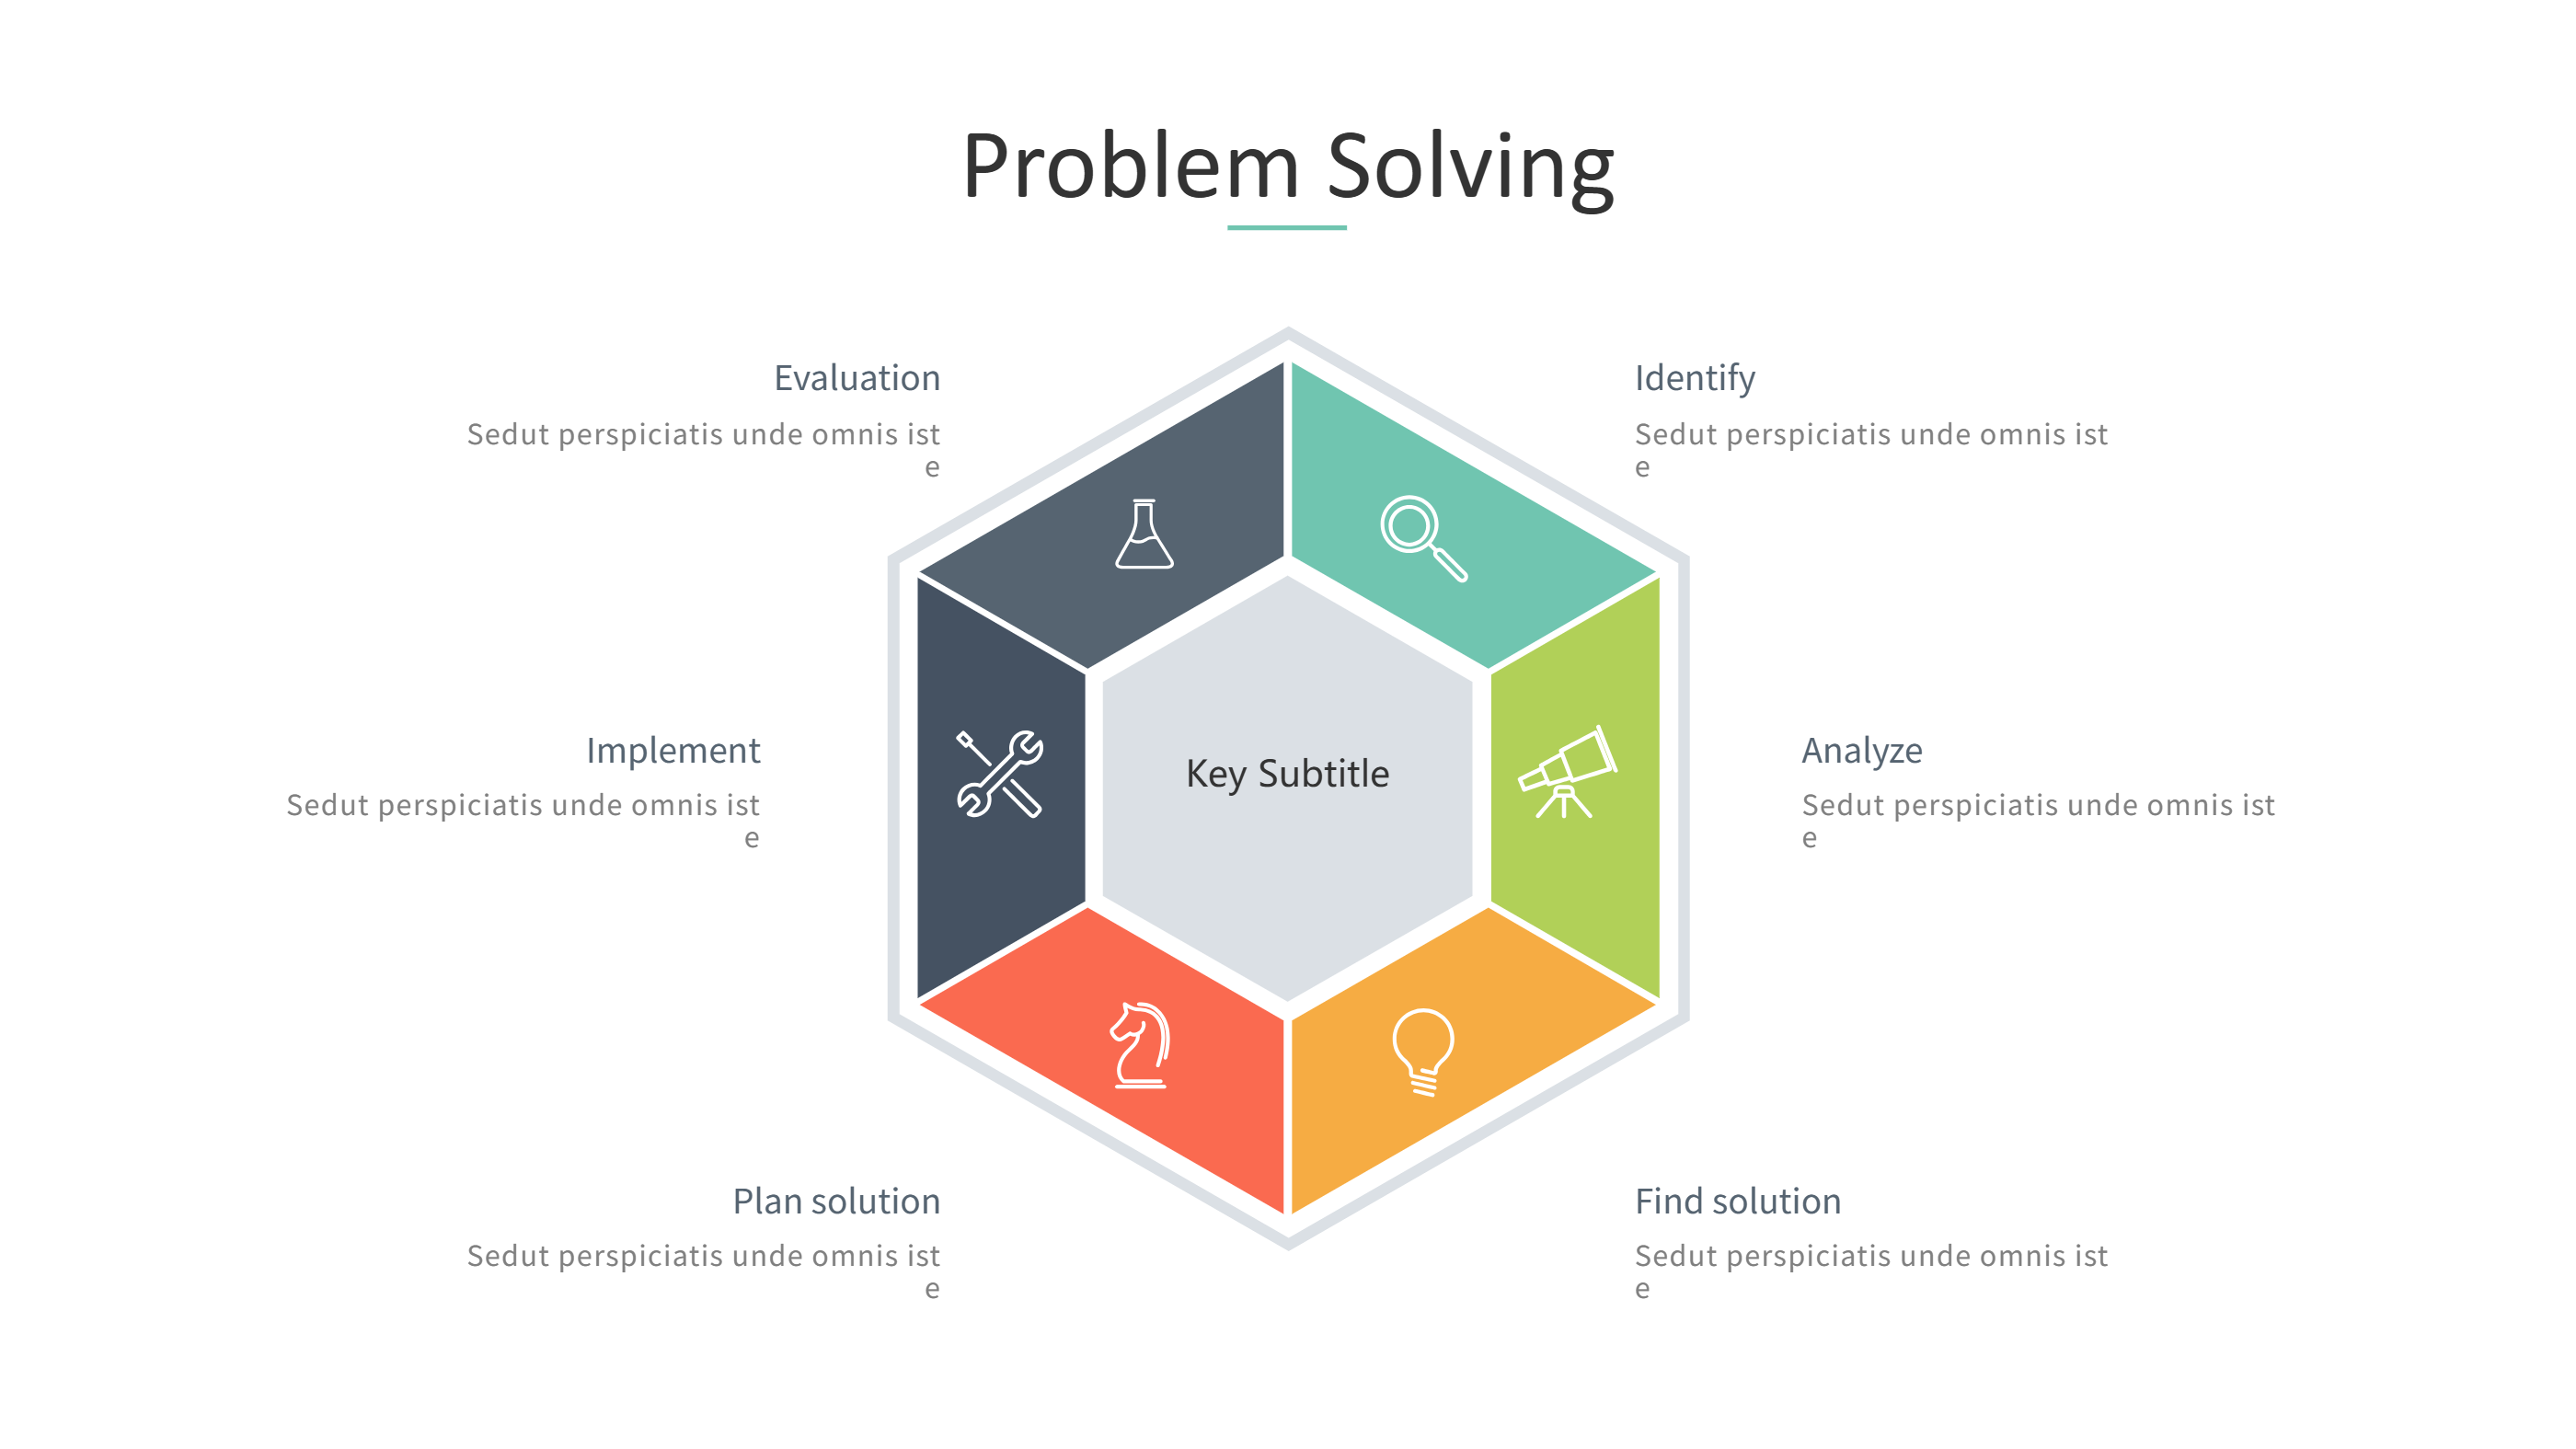
Write labels with plain words like growth, cost, reach, or time. Keep each sentence short to protect readability on small screens. Swap colors to match your brand or to highlight wins and risks. Add light icons to signal data type while avoiding clutter. The balanced spacing keeps the design steady when you export for widescreen, square, or vertical formats. Use simple fonts so the text looks clean across devices.
You can reuse the blocks by changing numbers and short captions without redrawing the layout. The clean style fits slides, social posts, and dashboards. Because it avoids complex motion, it loads quickly and stays easy to edit inside Premiere Pro. You can also hand it to teammates who are new to editing without extra training.
Open the AI creation tool on the homepage, choose this template, and type a short prompt to build the infographic. This MOGRT-friendly chart set keeps data clear, speeds up production, and gives you polished visuals without starting from zero.