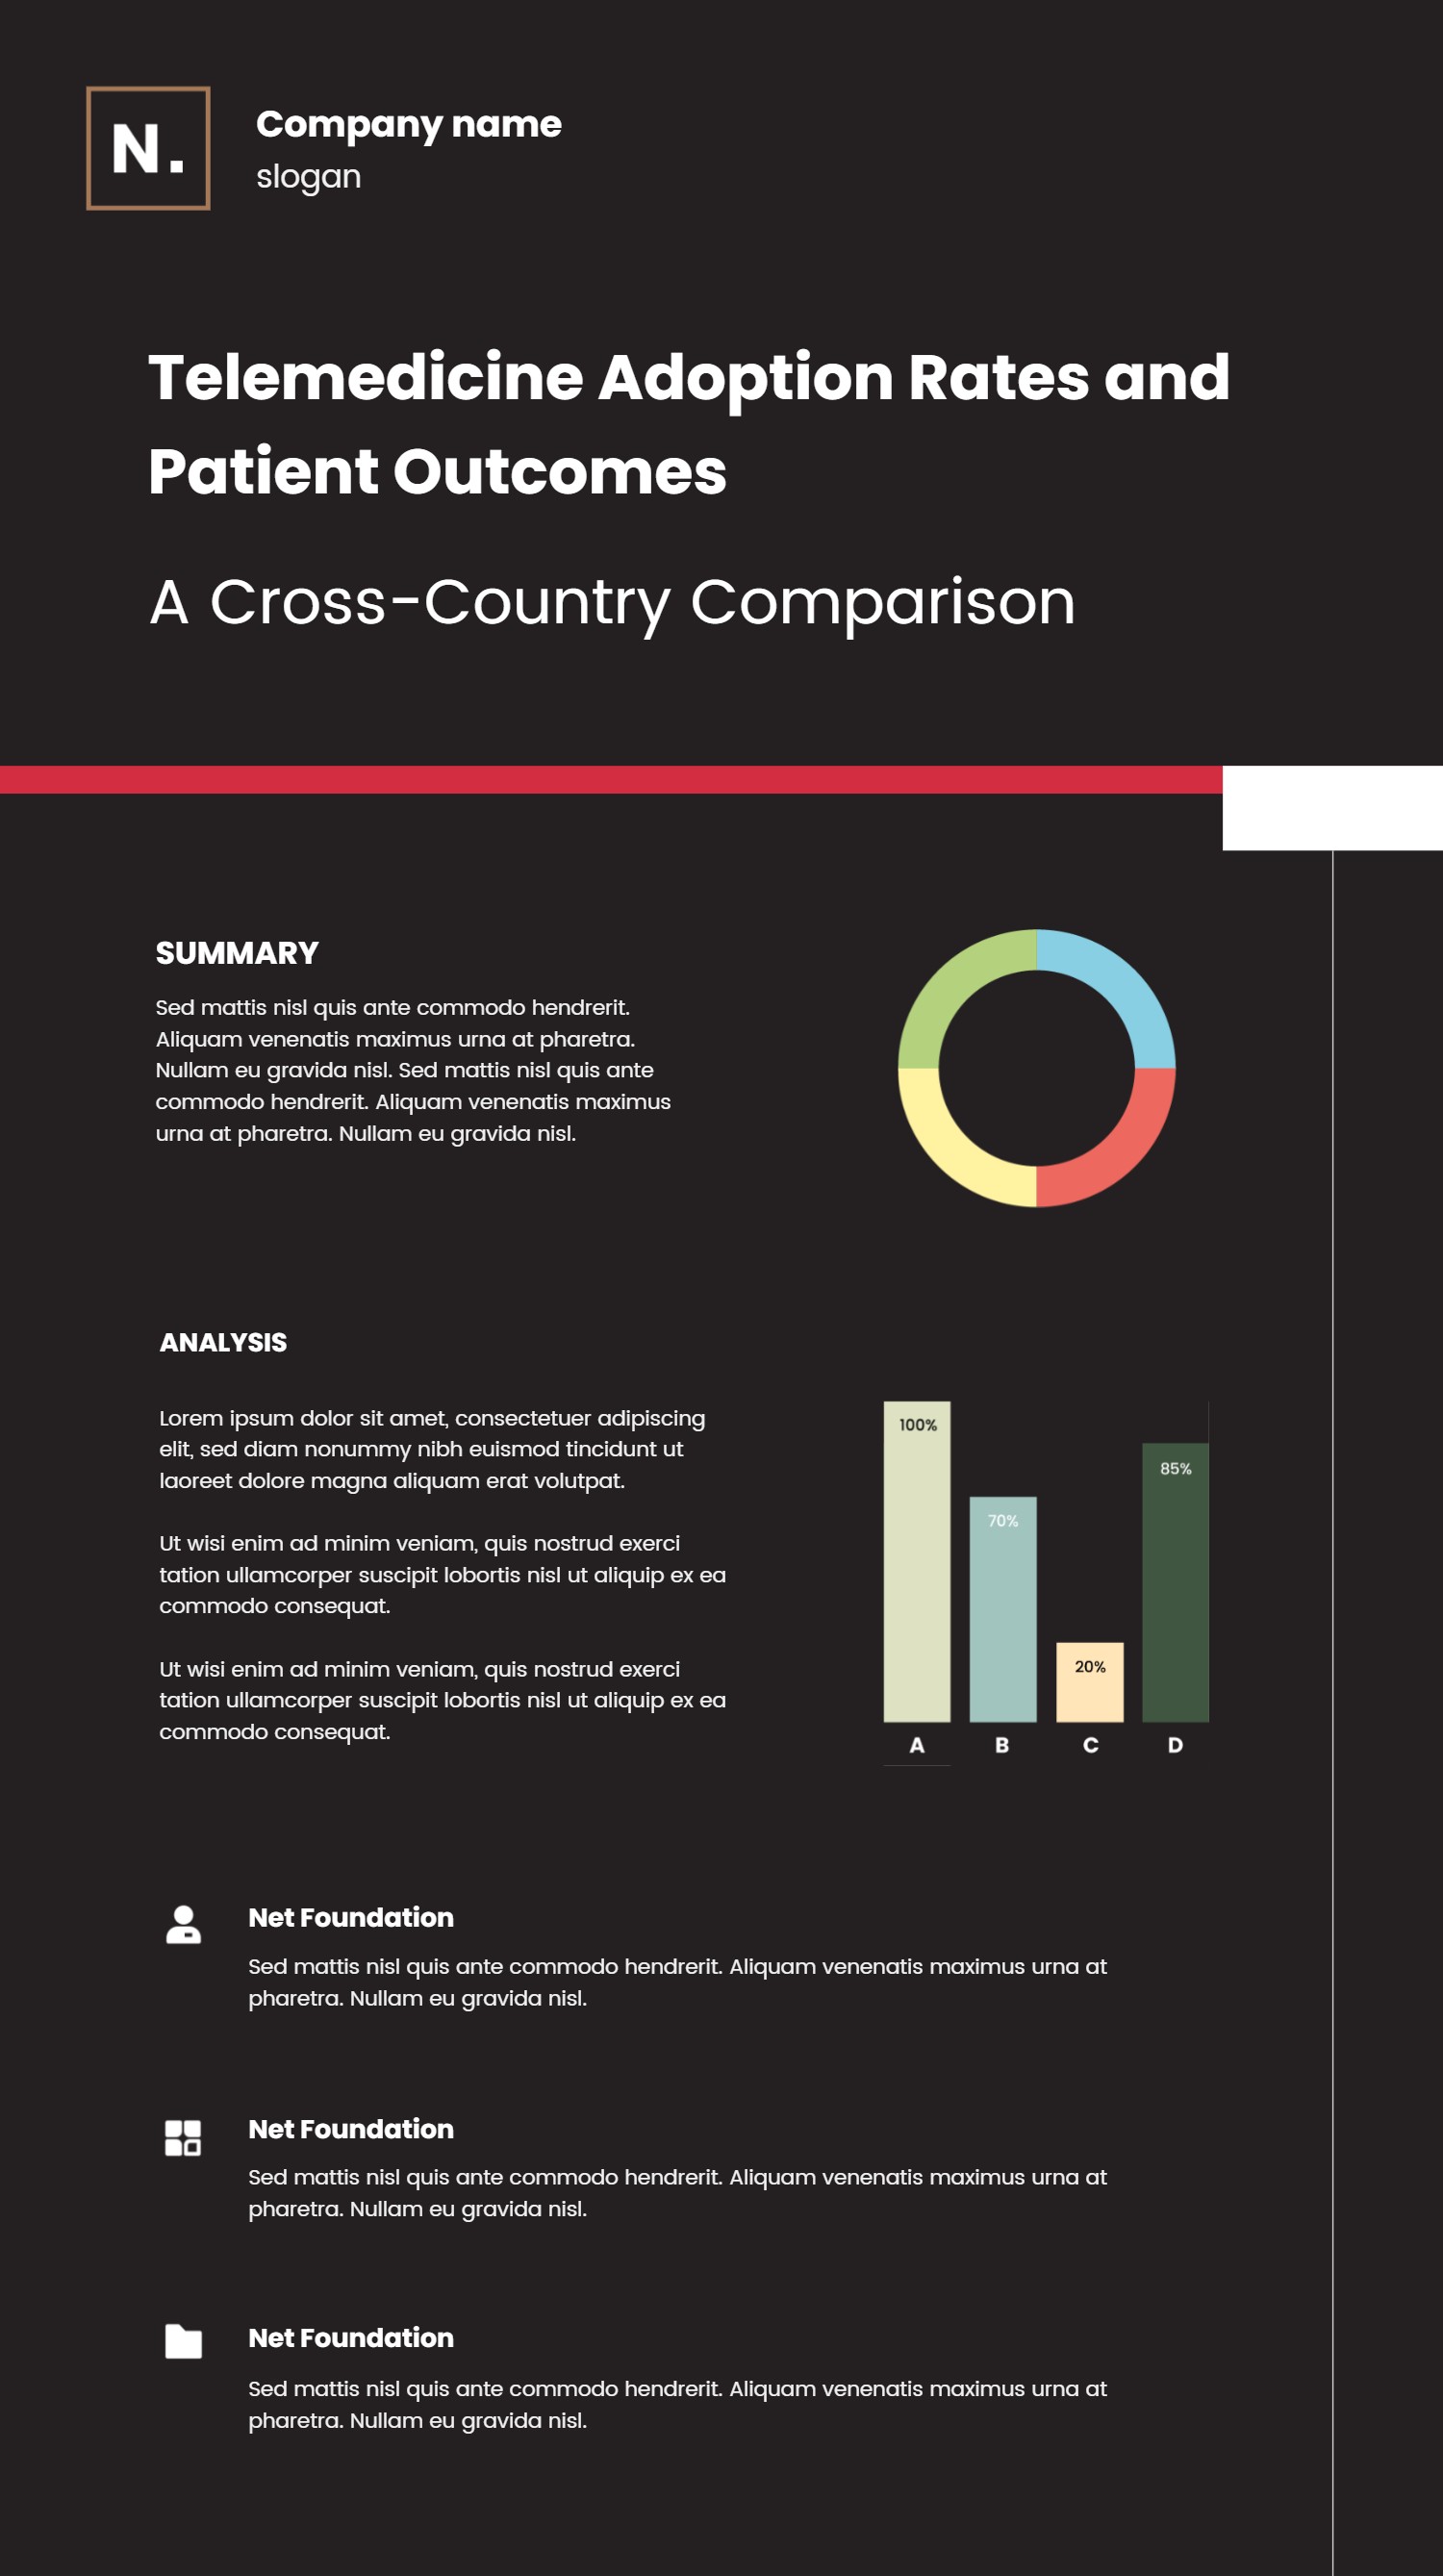
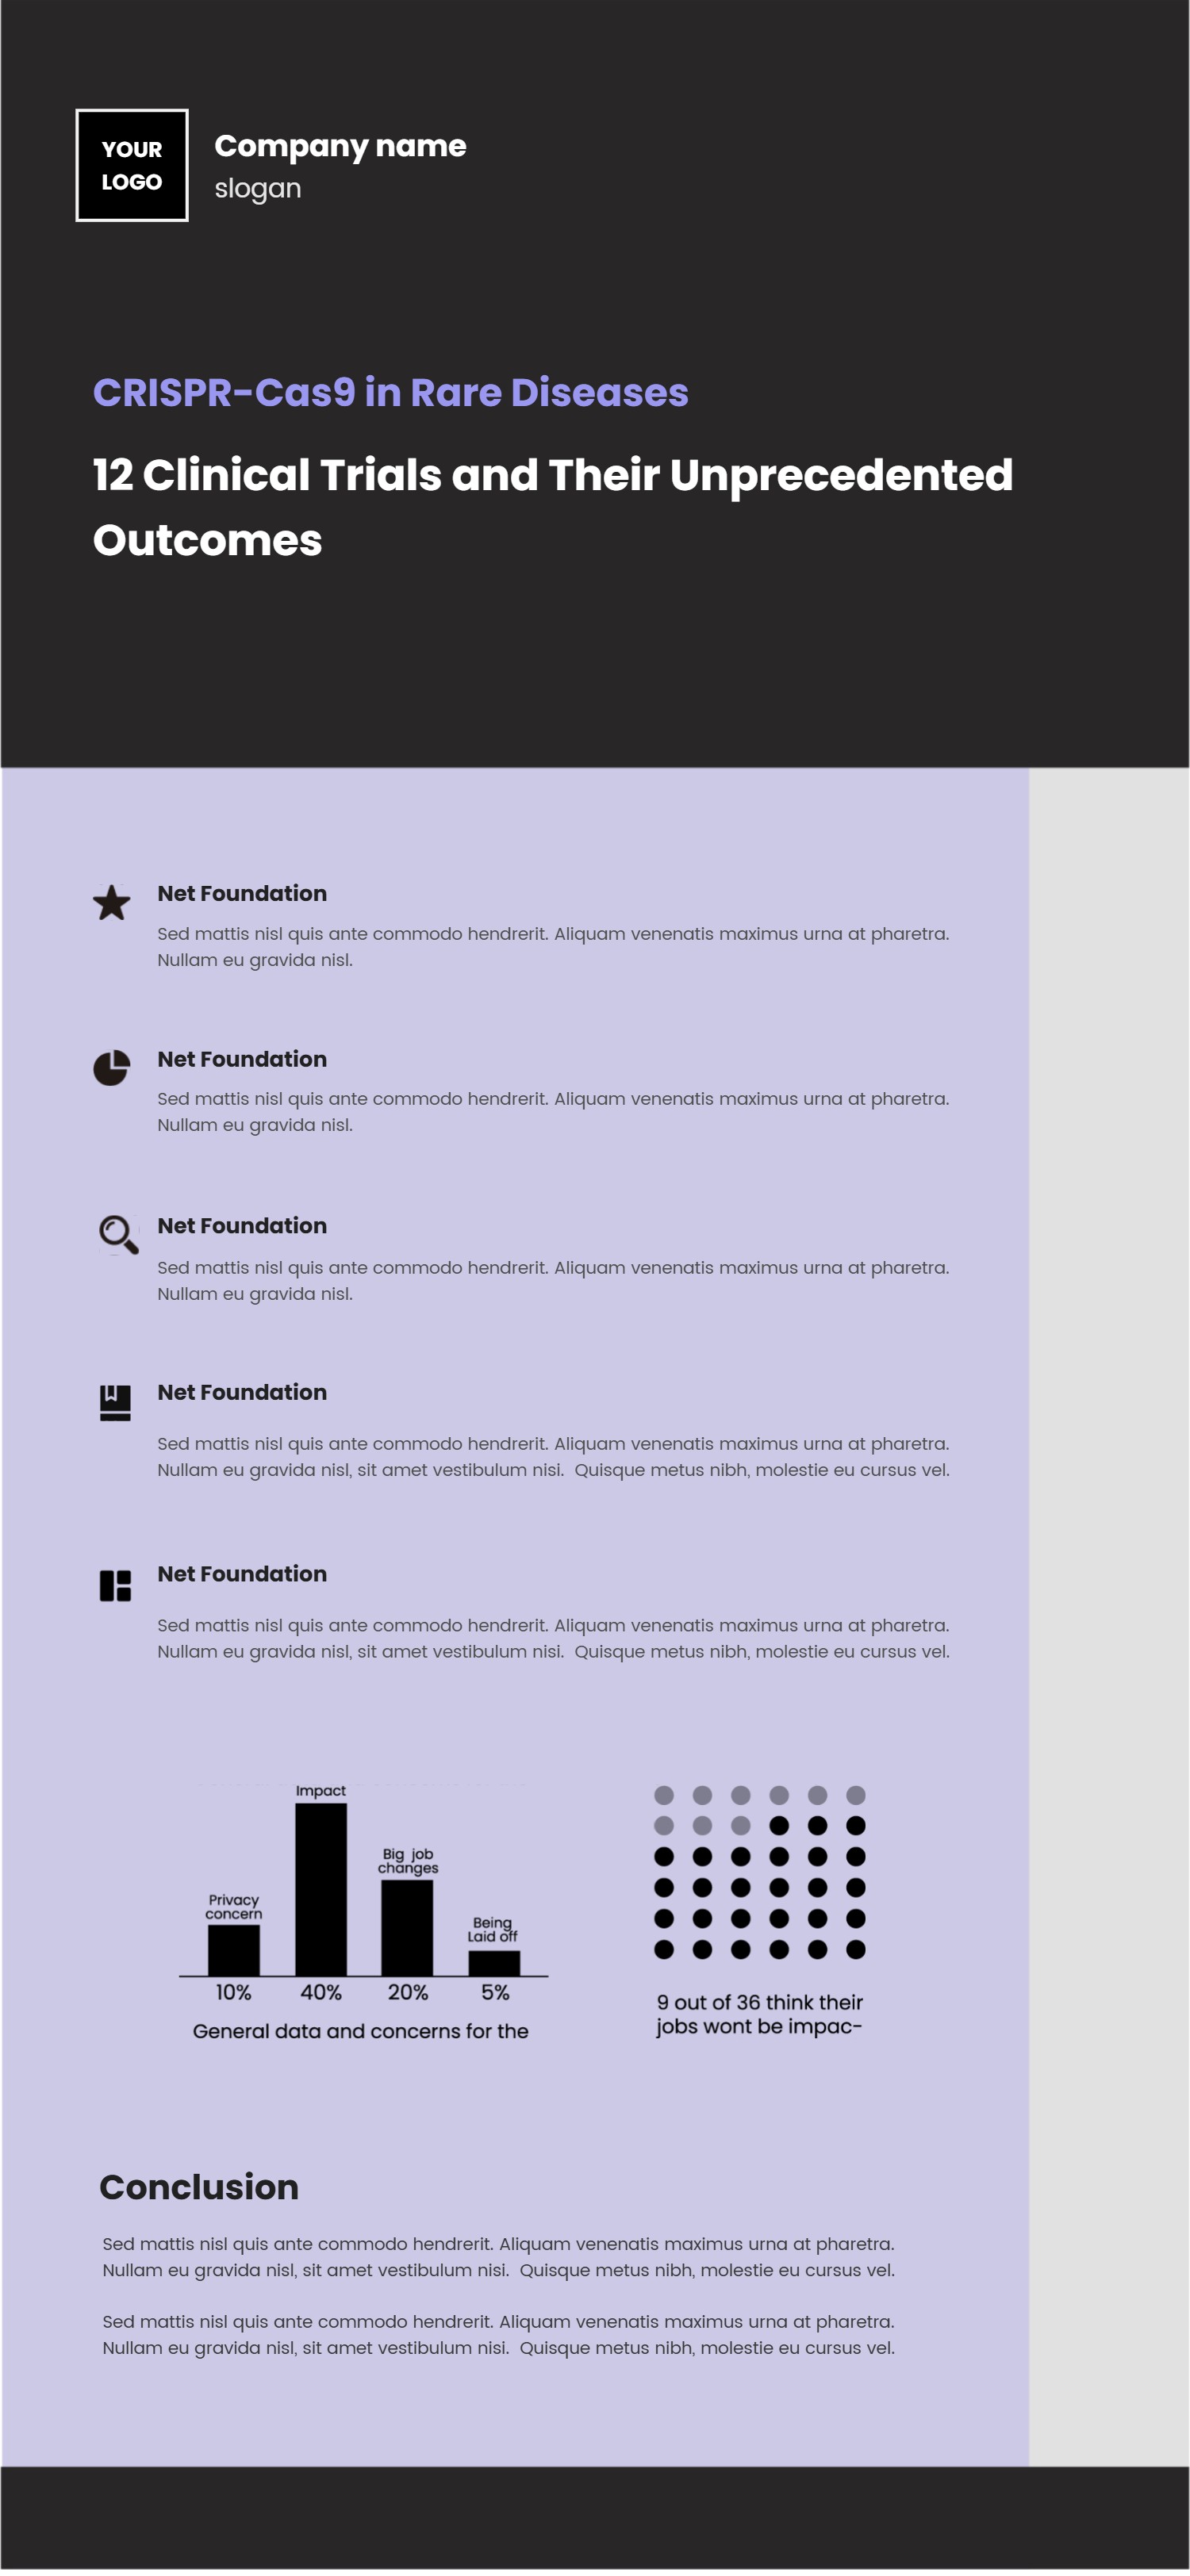
Scientific Infographic White Paper Layout Template
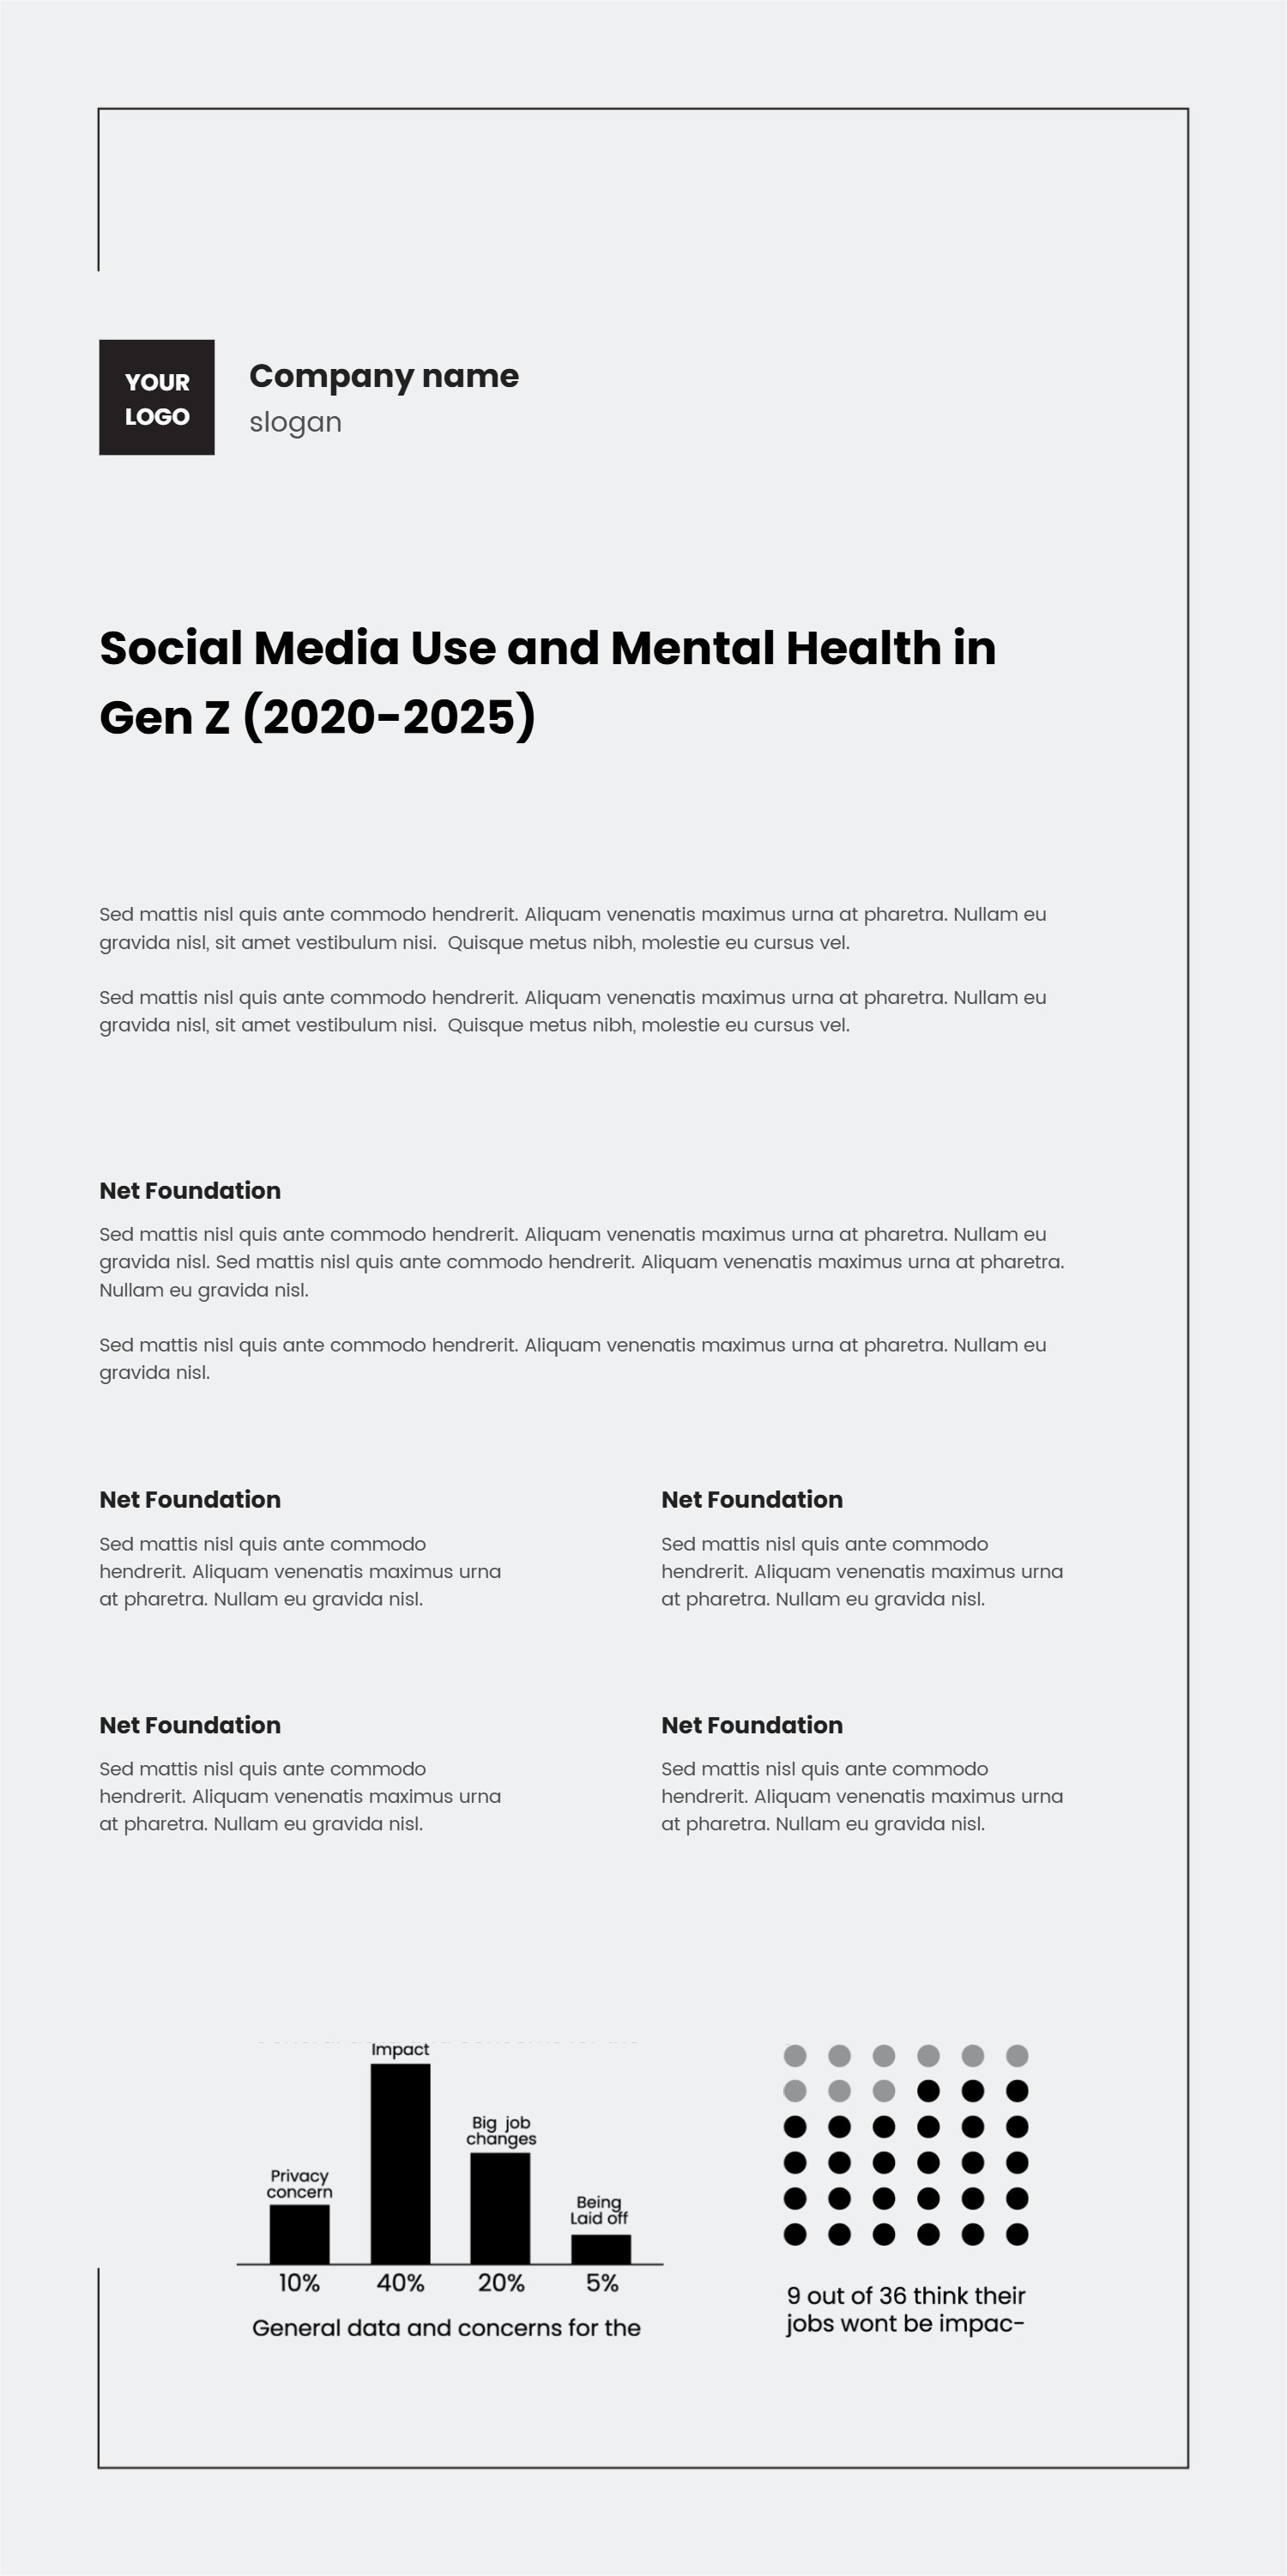
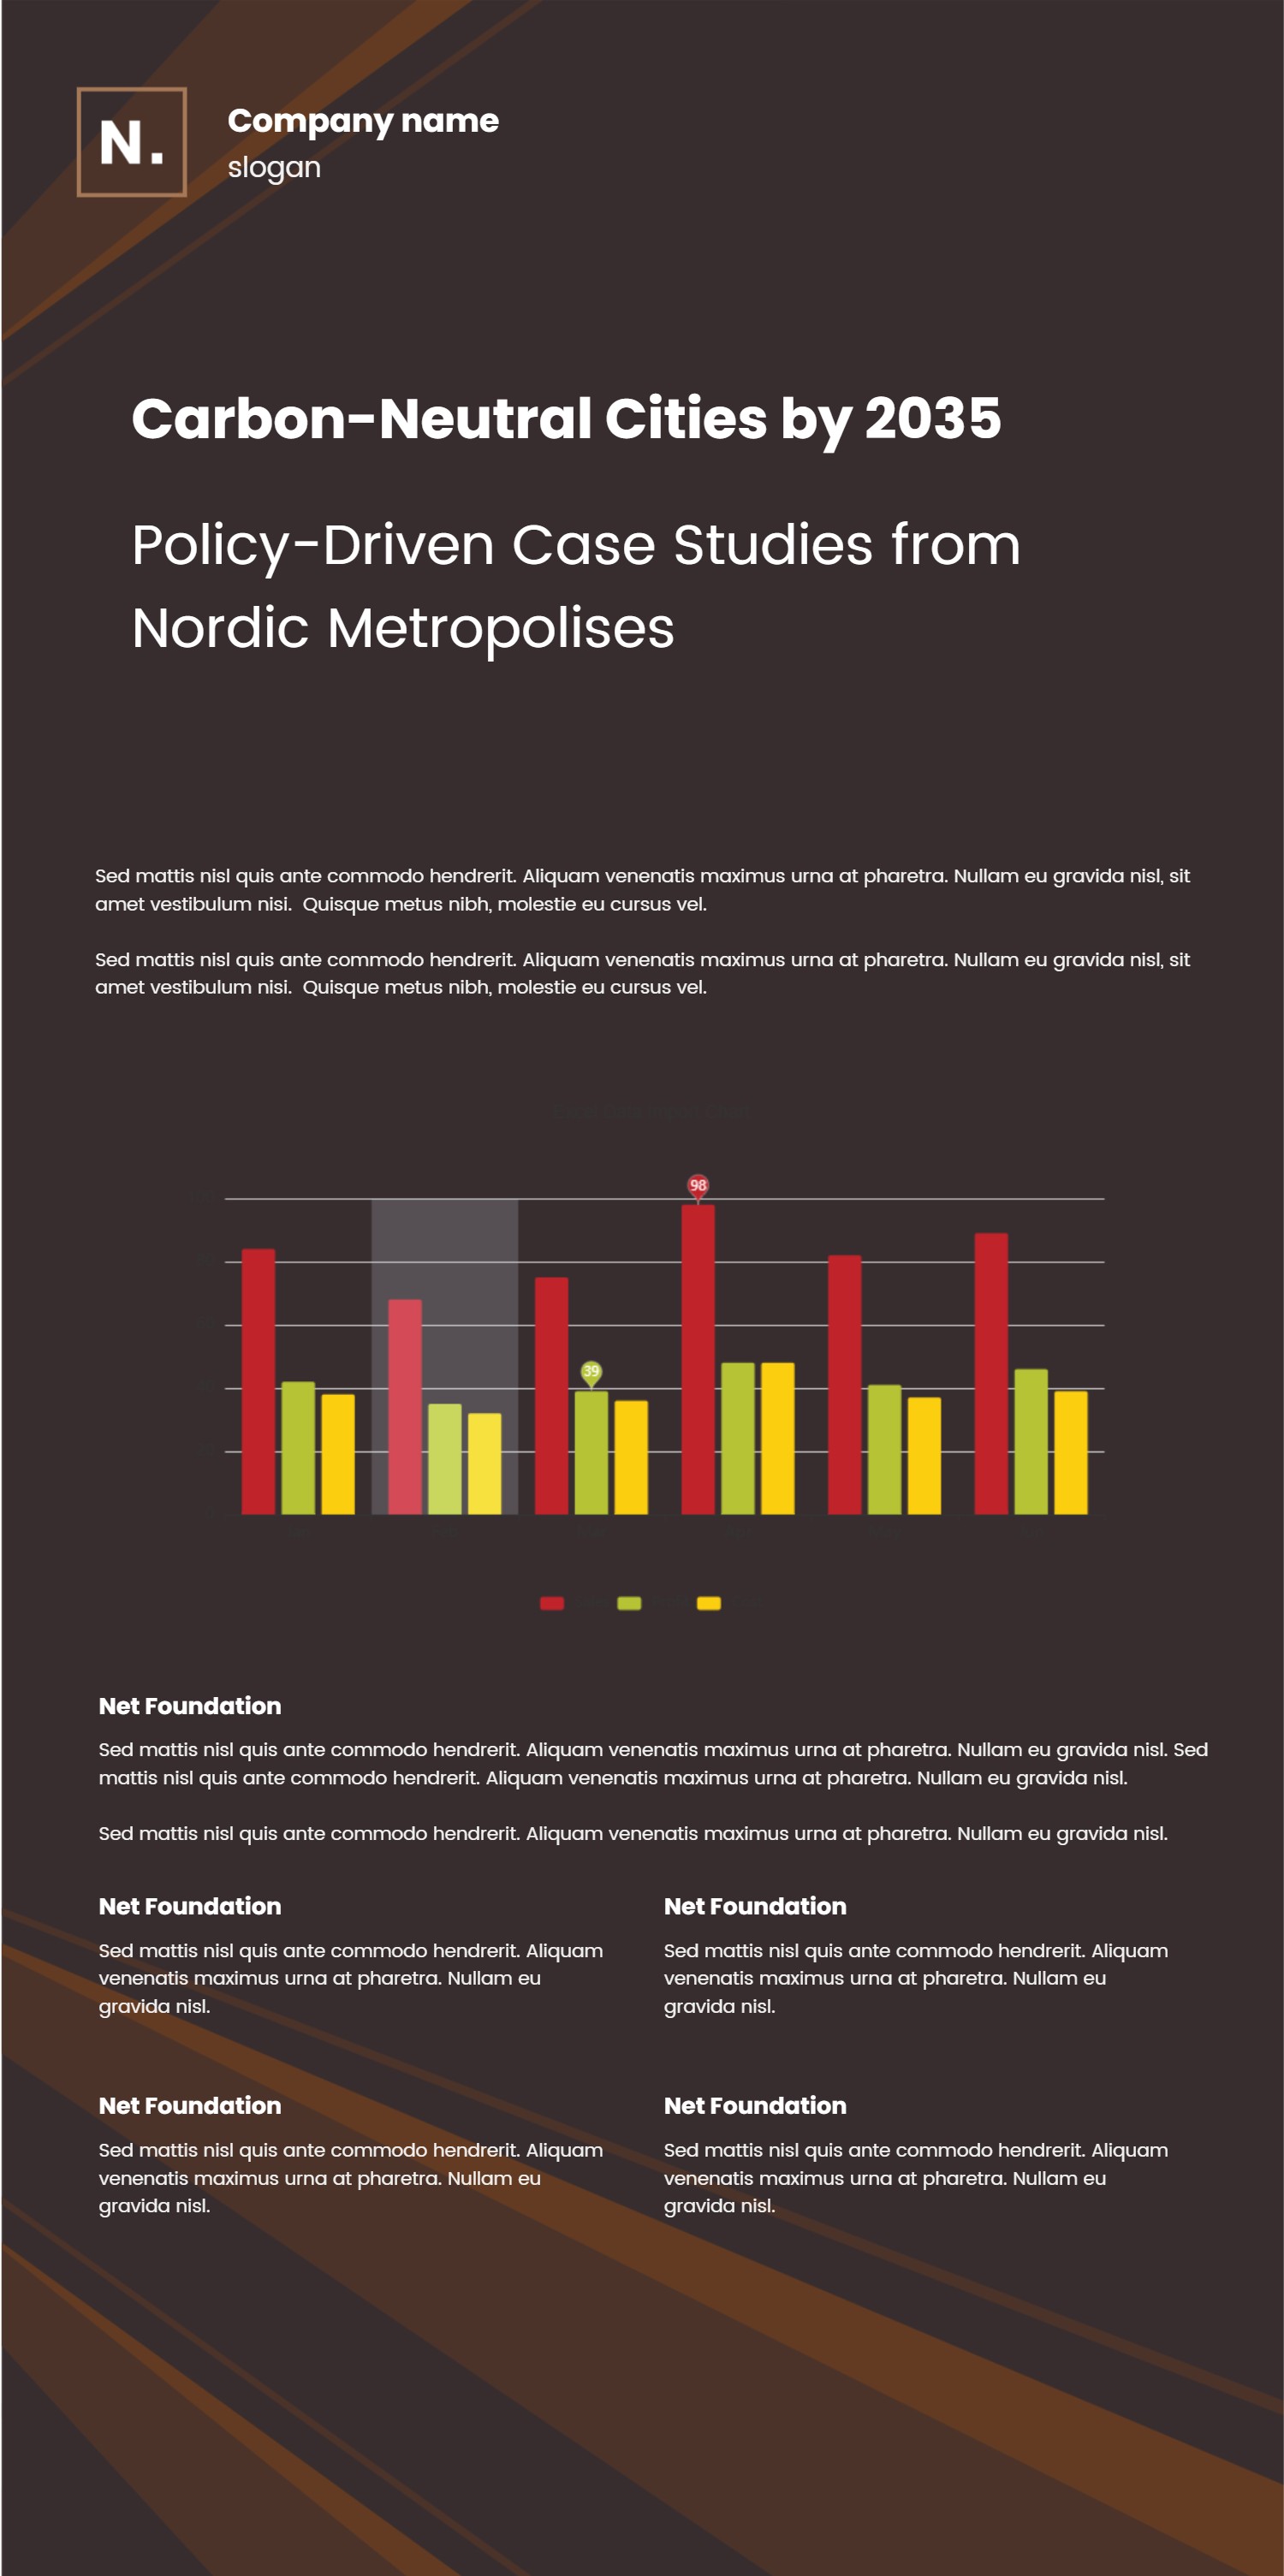
This scientific infographic uses a minimalist white paper layout with bar charts and a dot matrix. It presents complex findings in a calm, two-tone design. The dark header supports a clear title and subtitle, while the body holds modular blocks for methods, results, and key insights.
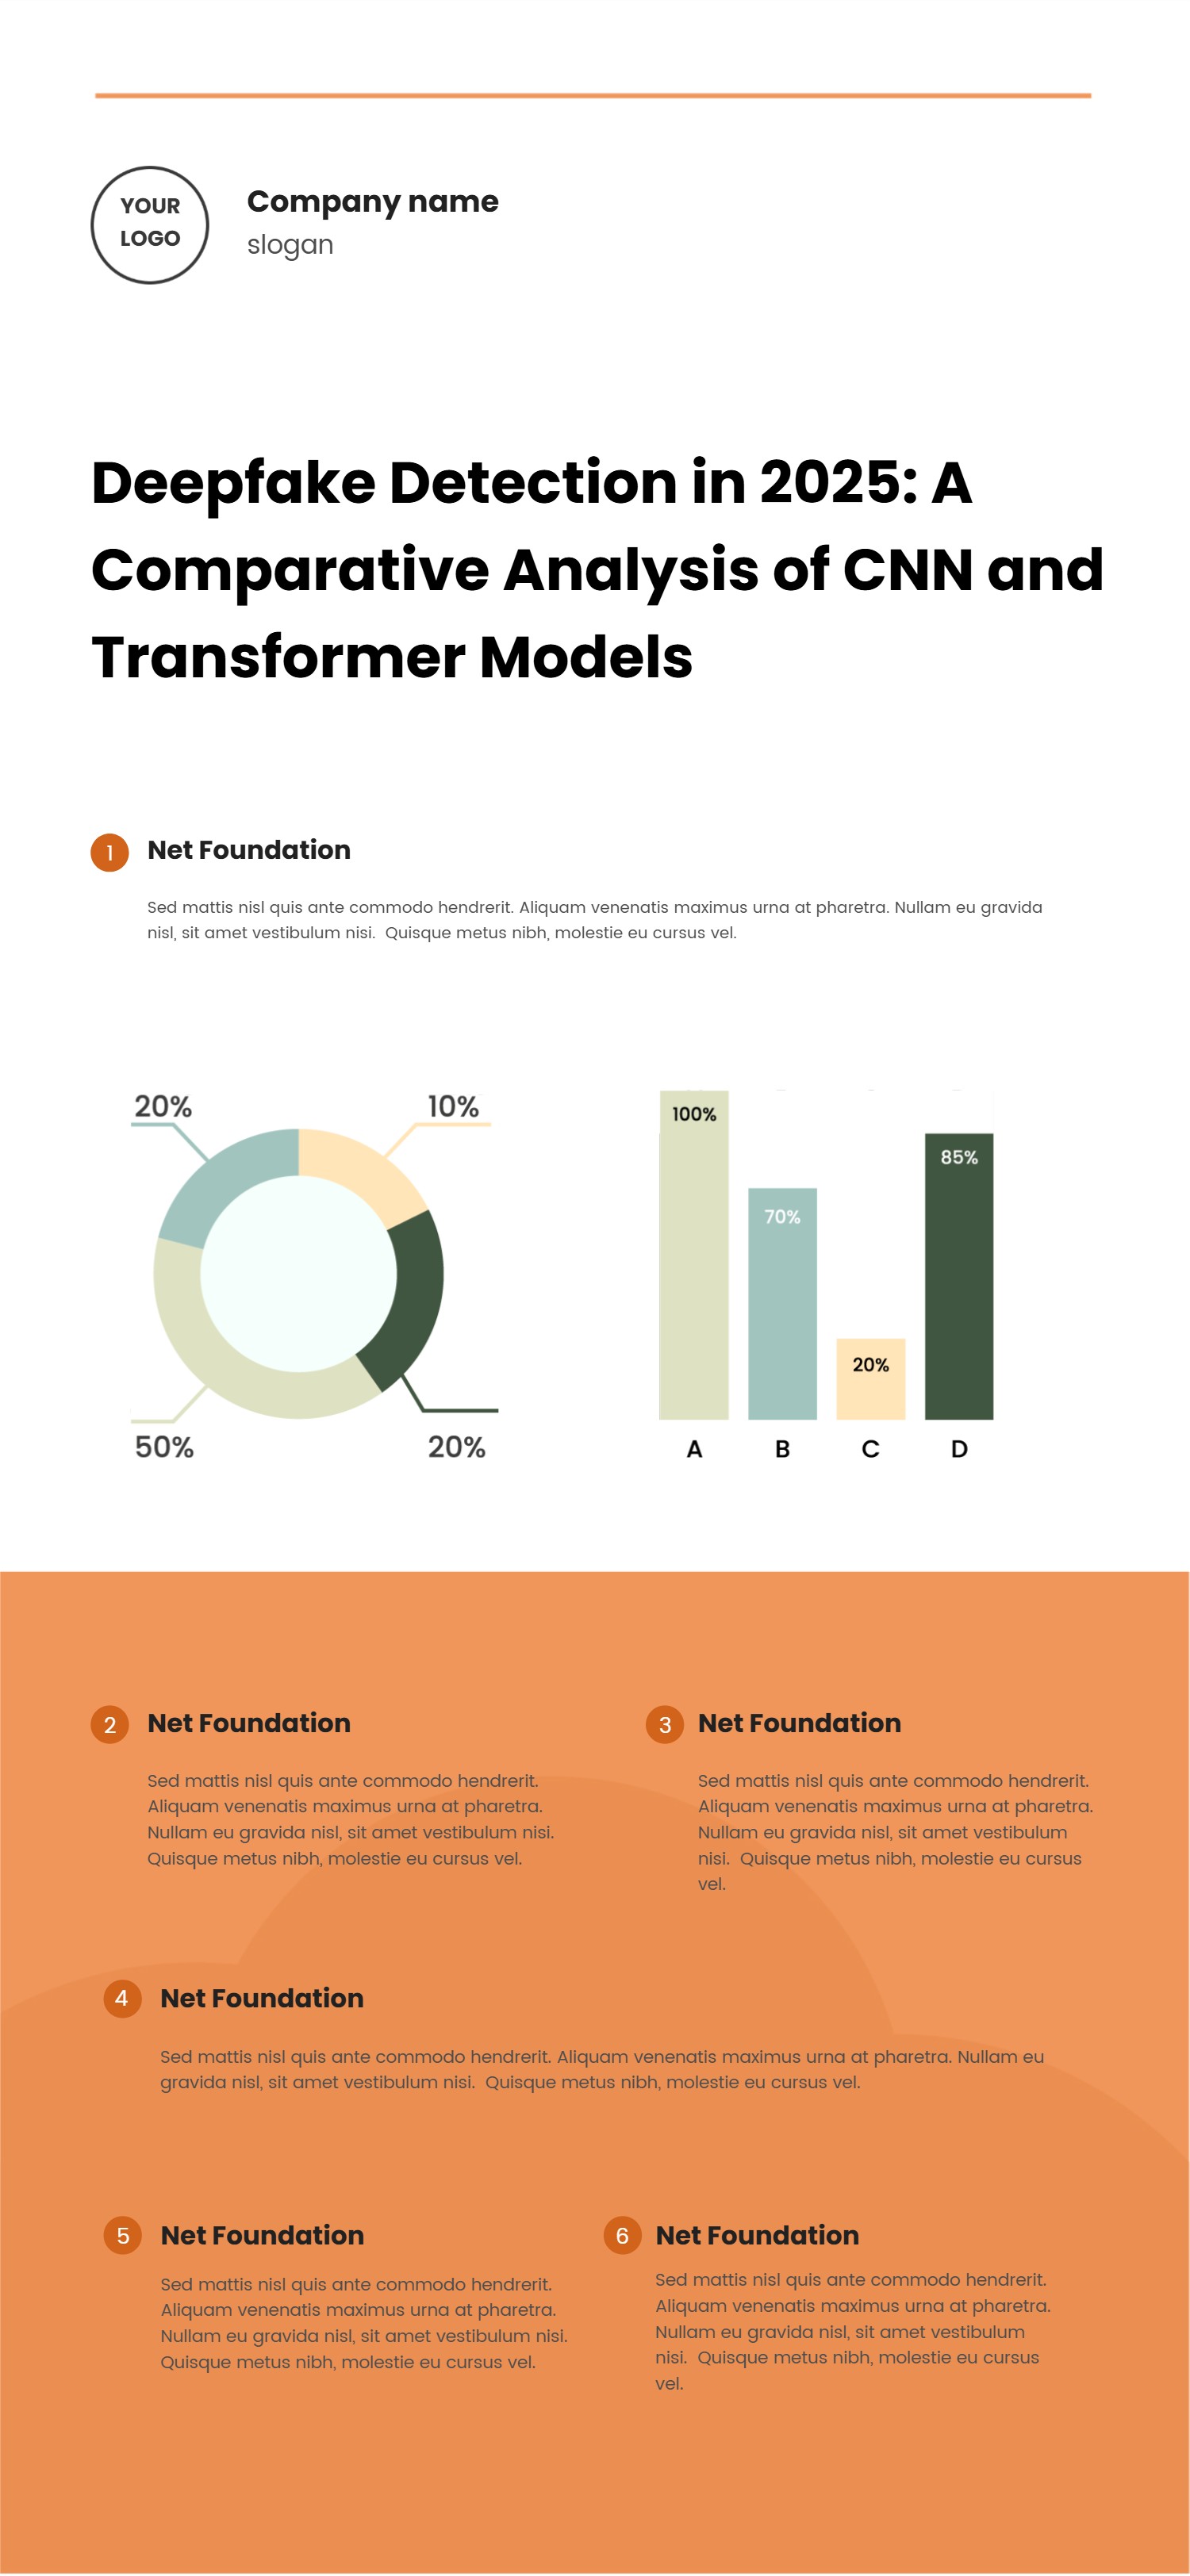
Use it to share lab summaries, field reports, or research proposals. Keep sentences short and replace jargon with plain terms. Add one block for the research question, one for the setup, one for the main data points, and one for conclusions. The bar chart and dot matrix areas give you room for sample sizes and simple percentages.
Include notes about sample limits, error ranges, and next steps. If you present to a mixed audience, add a small glossary for any special word. This scientific infographic keeps the look professional while staying friendly to non-experts.
To generate it fast, open the AI generation tool on the home page, choose this scientific infographic template, enter a prompt with your topic, sections, and colors, and the tool will output the graphic for download.
Share it in slide decks, emails, or posters. Update the numbers as your study changes. Because the design is clean, it prints well and fits on tablets without strain. Add a brief ethics note about respecting privacy, citing sources, and labeling estimates. This keeps the scientific infographic honest and useful for wide audiences. Suggest a review timeline so data gets refreshed on a clear schedule. Add one line about open data links and how to request raw tables for review.