Timeline Infographics Template
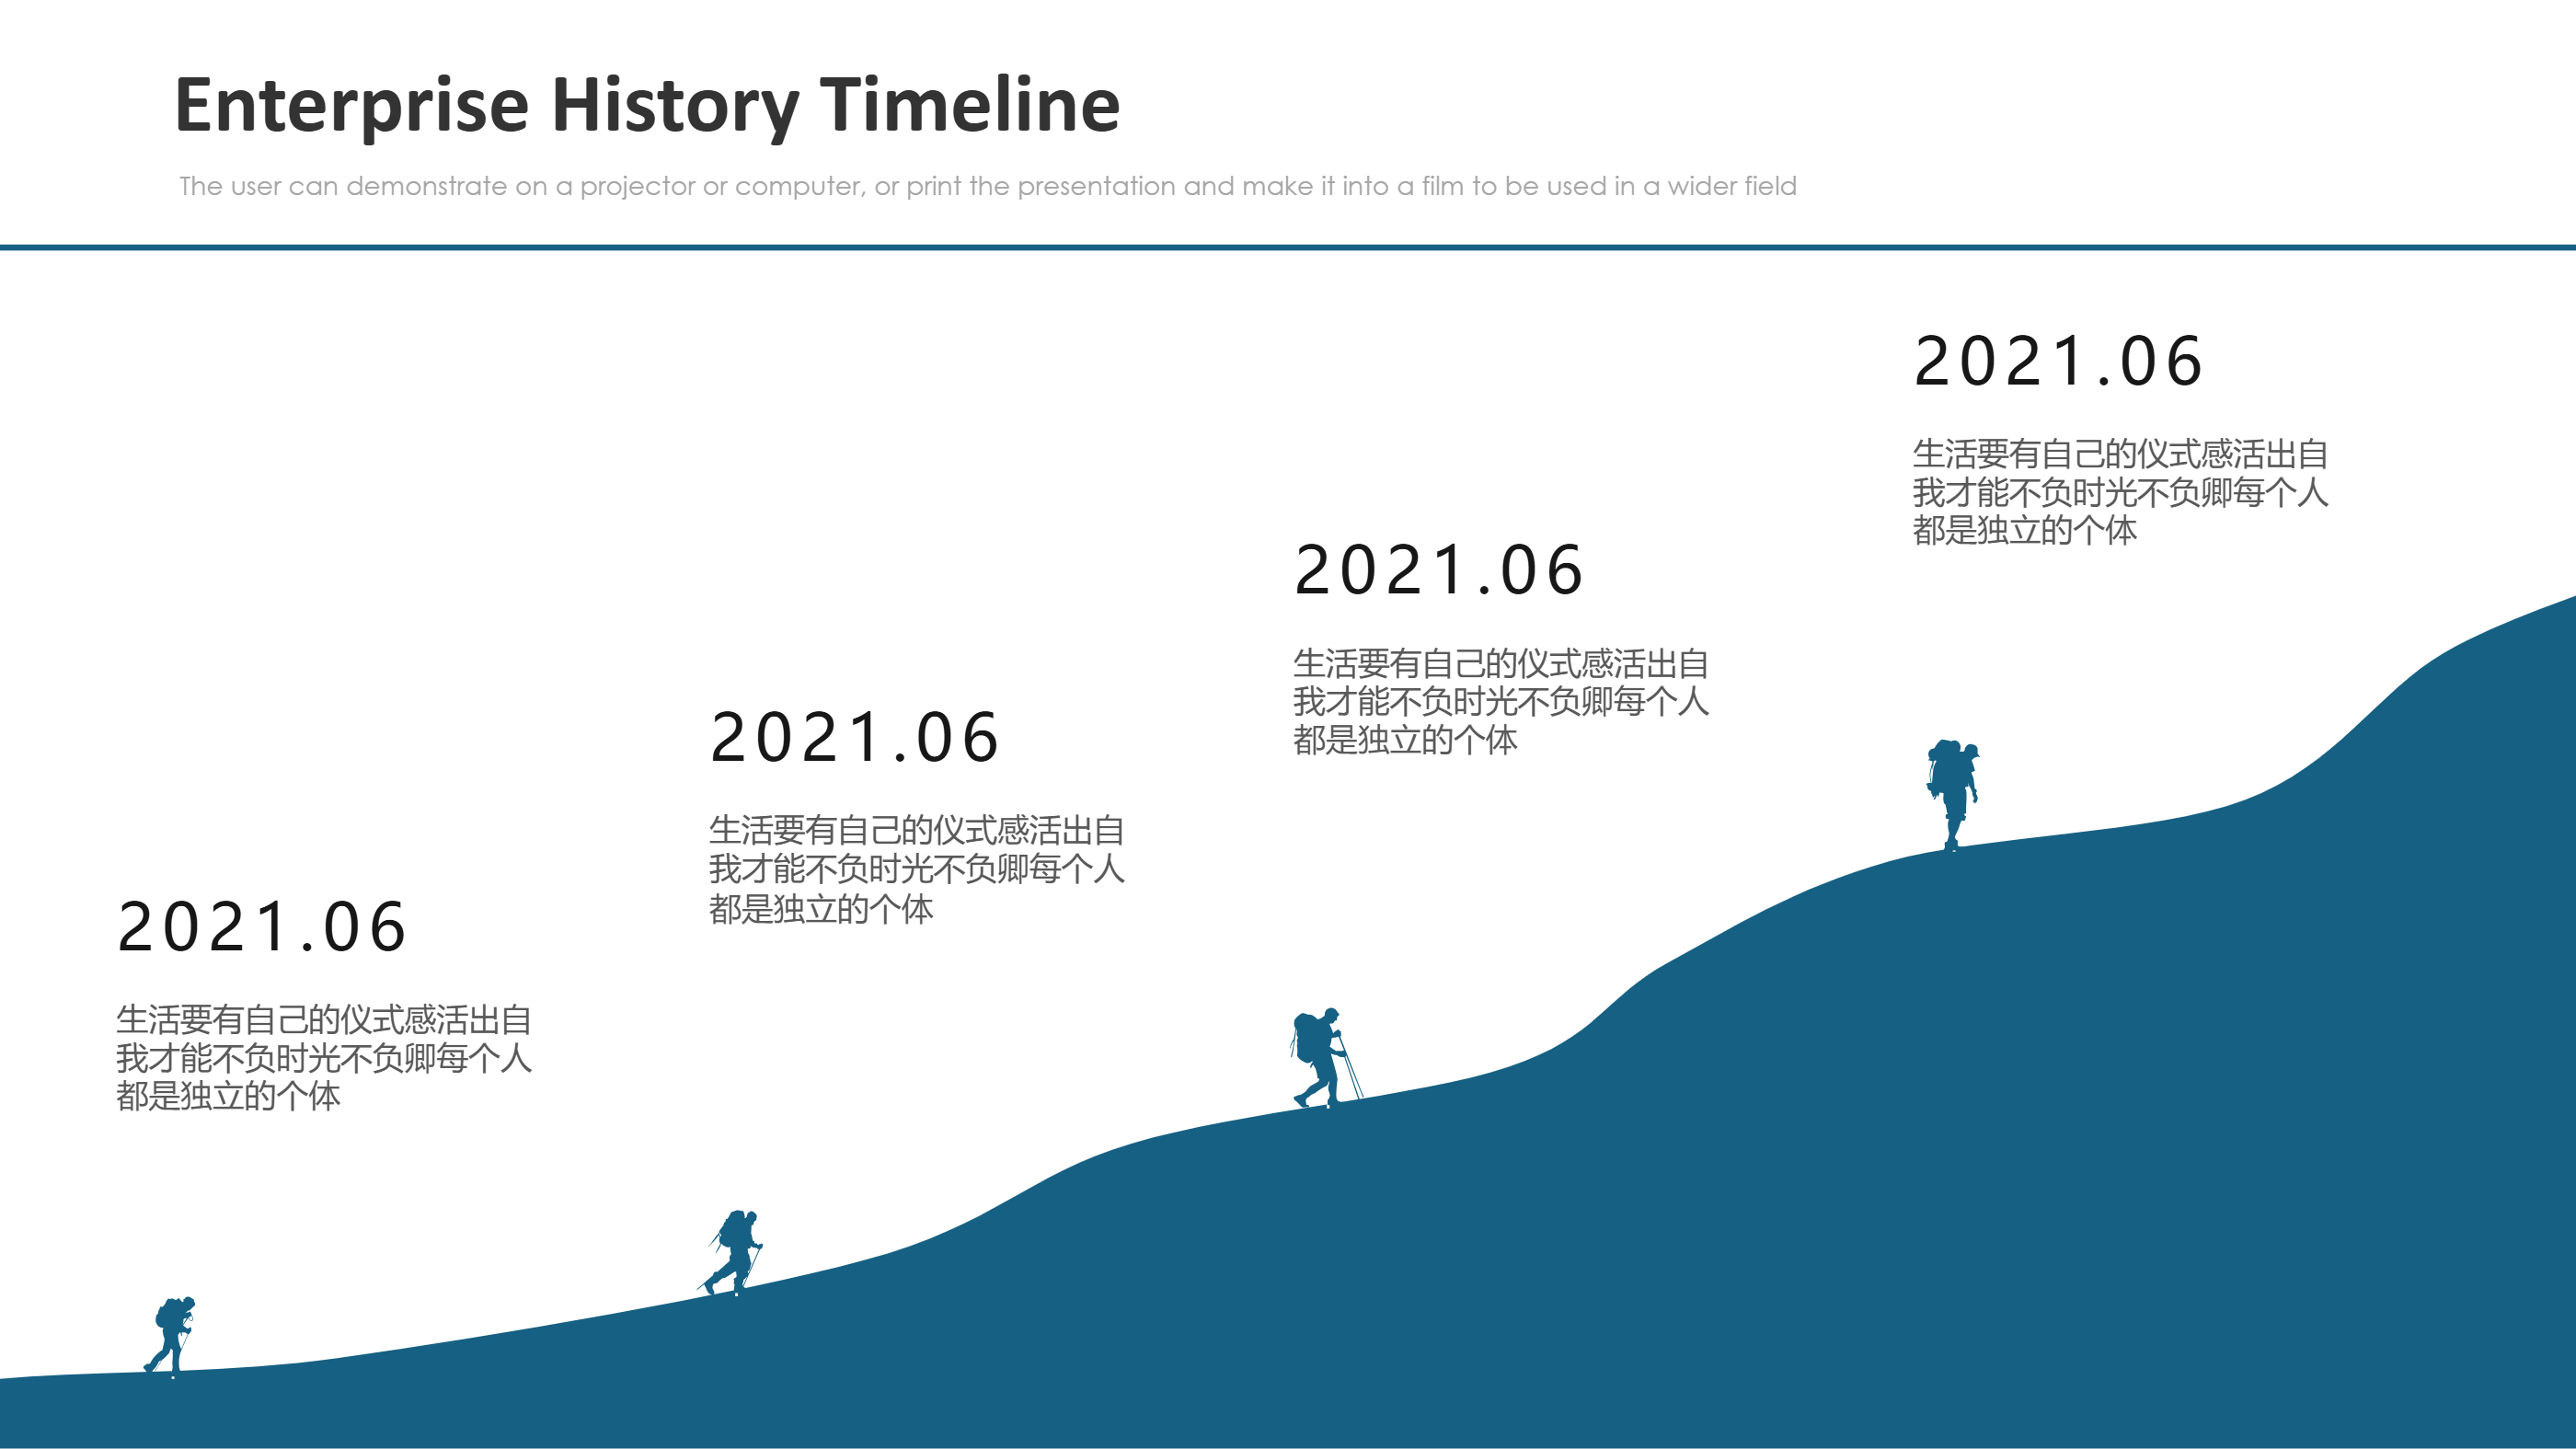
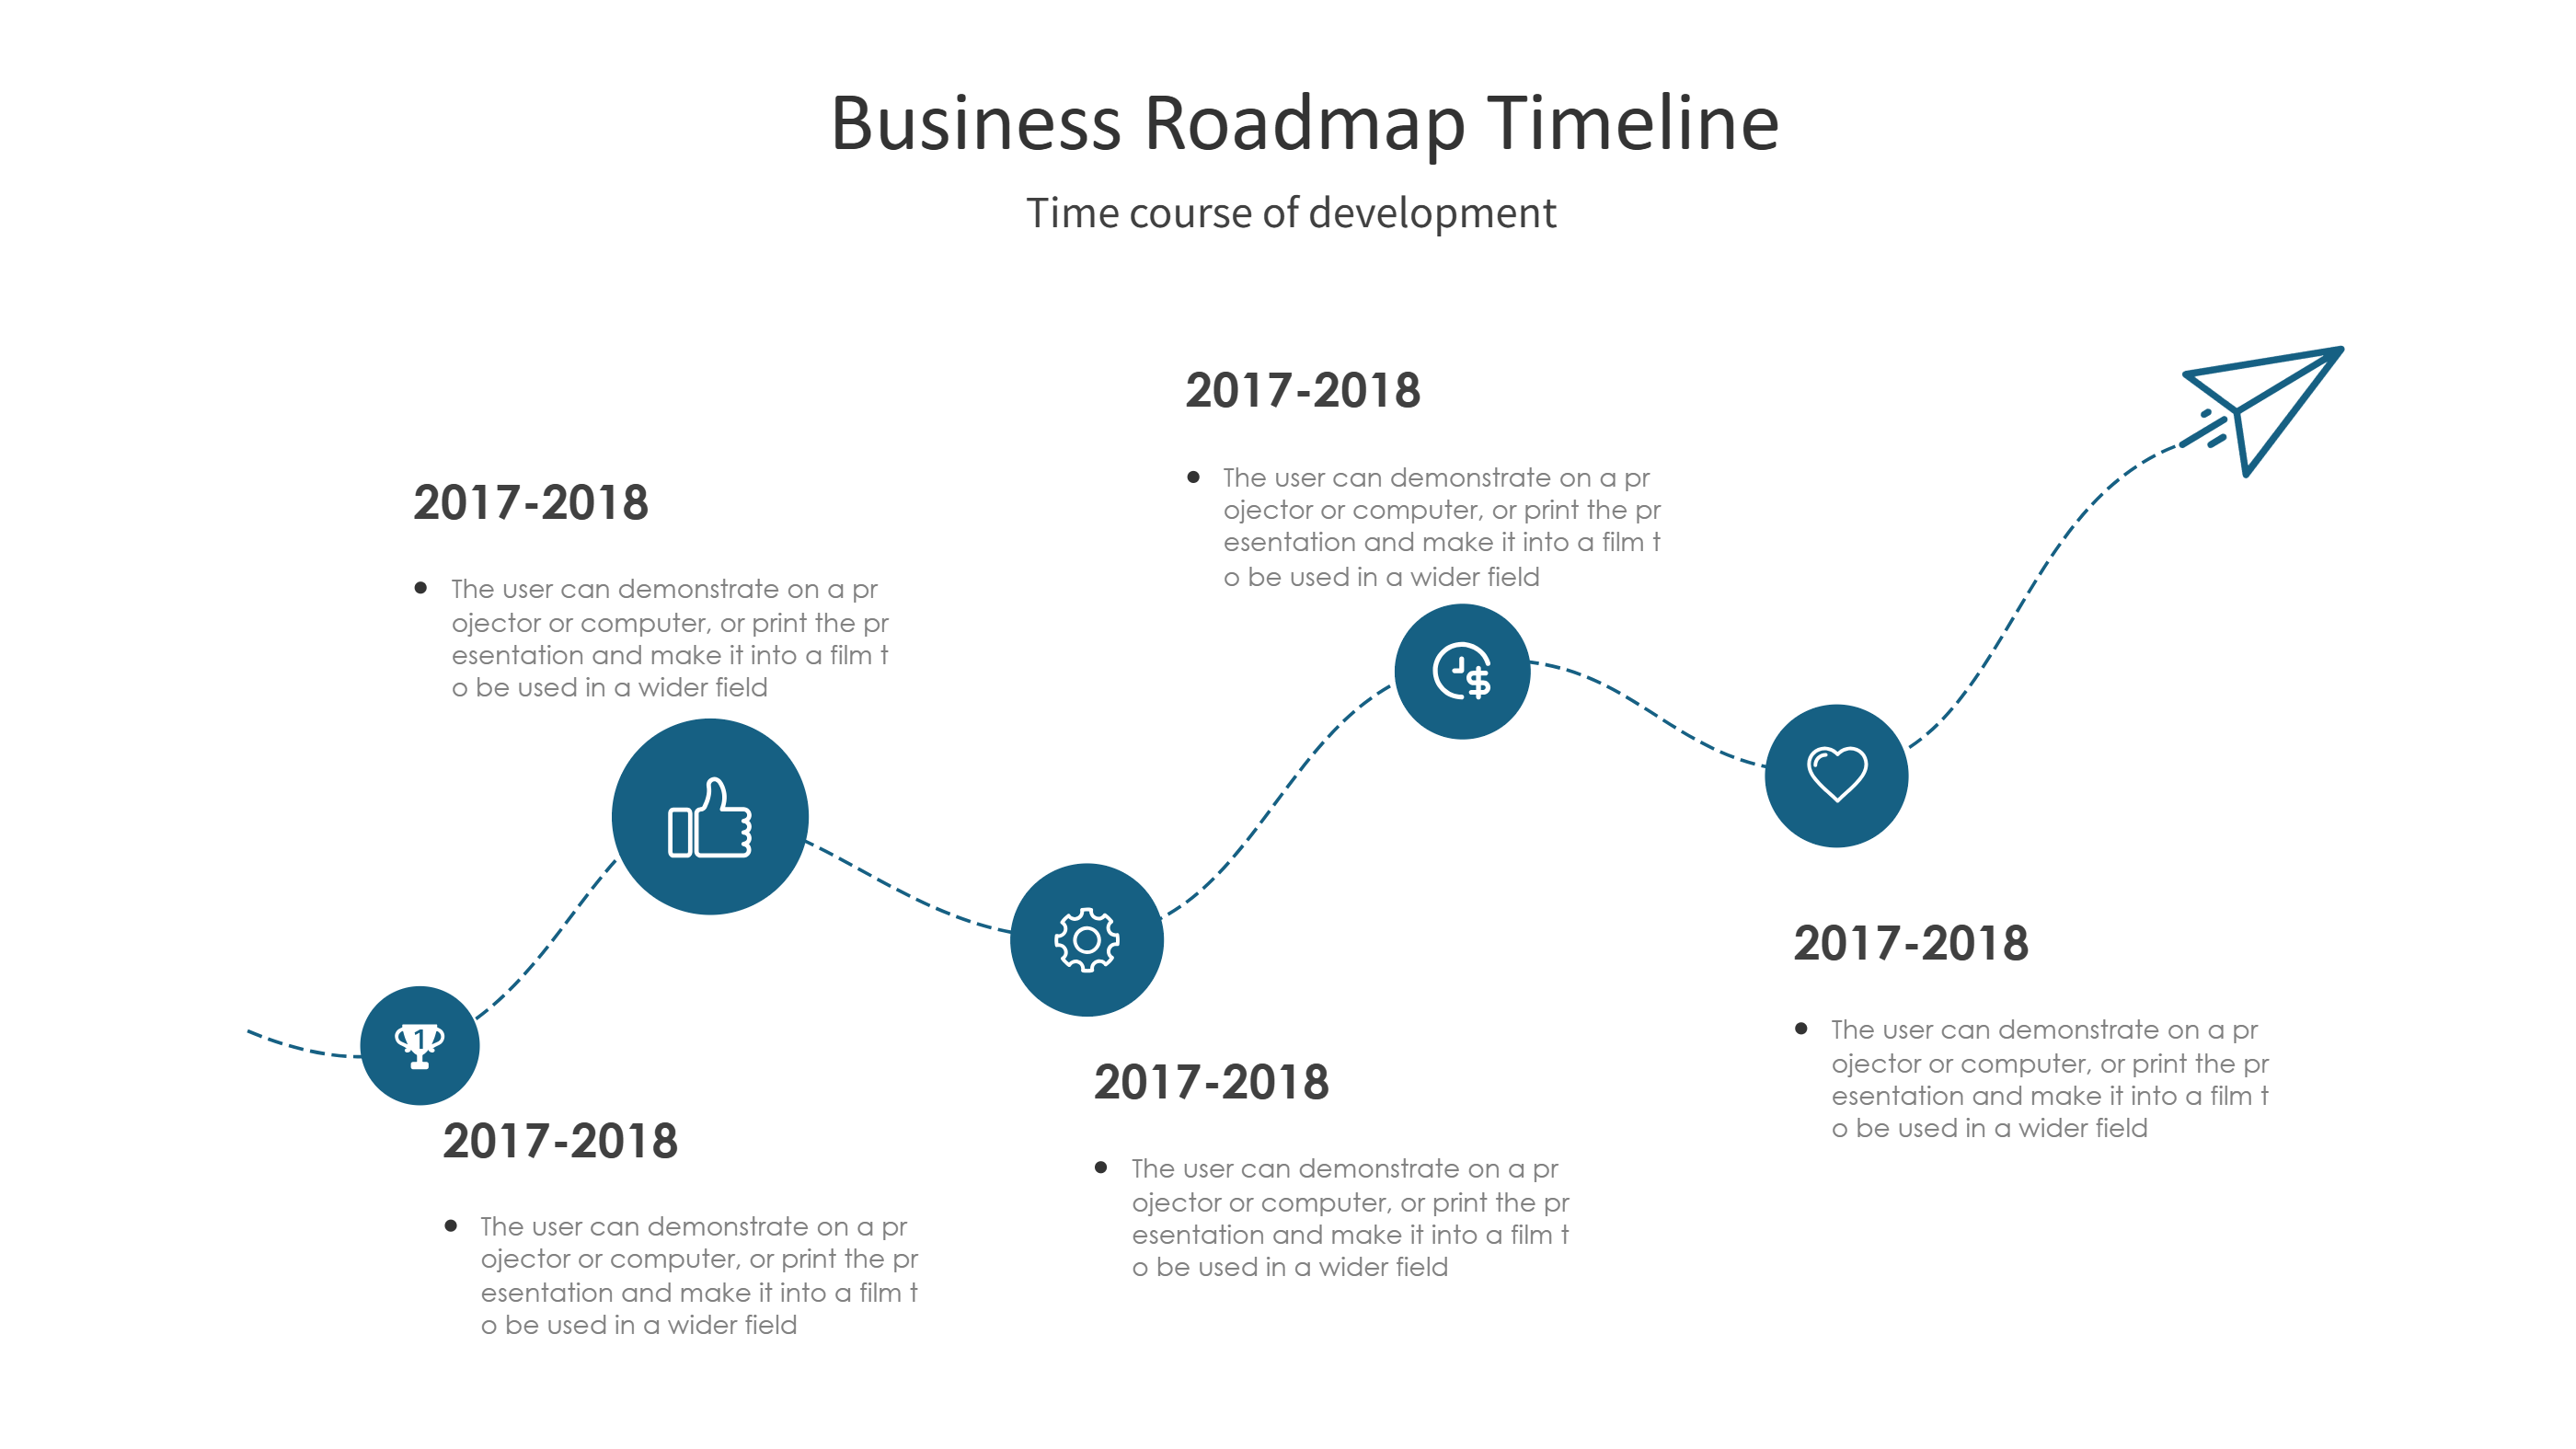
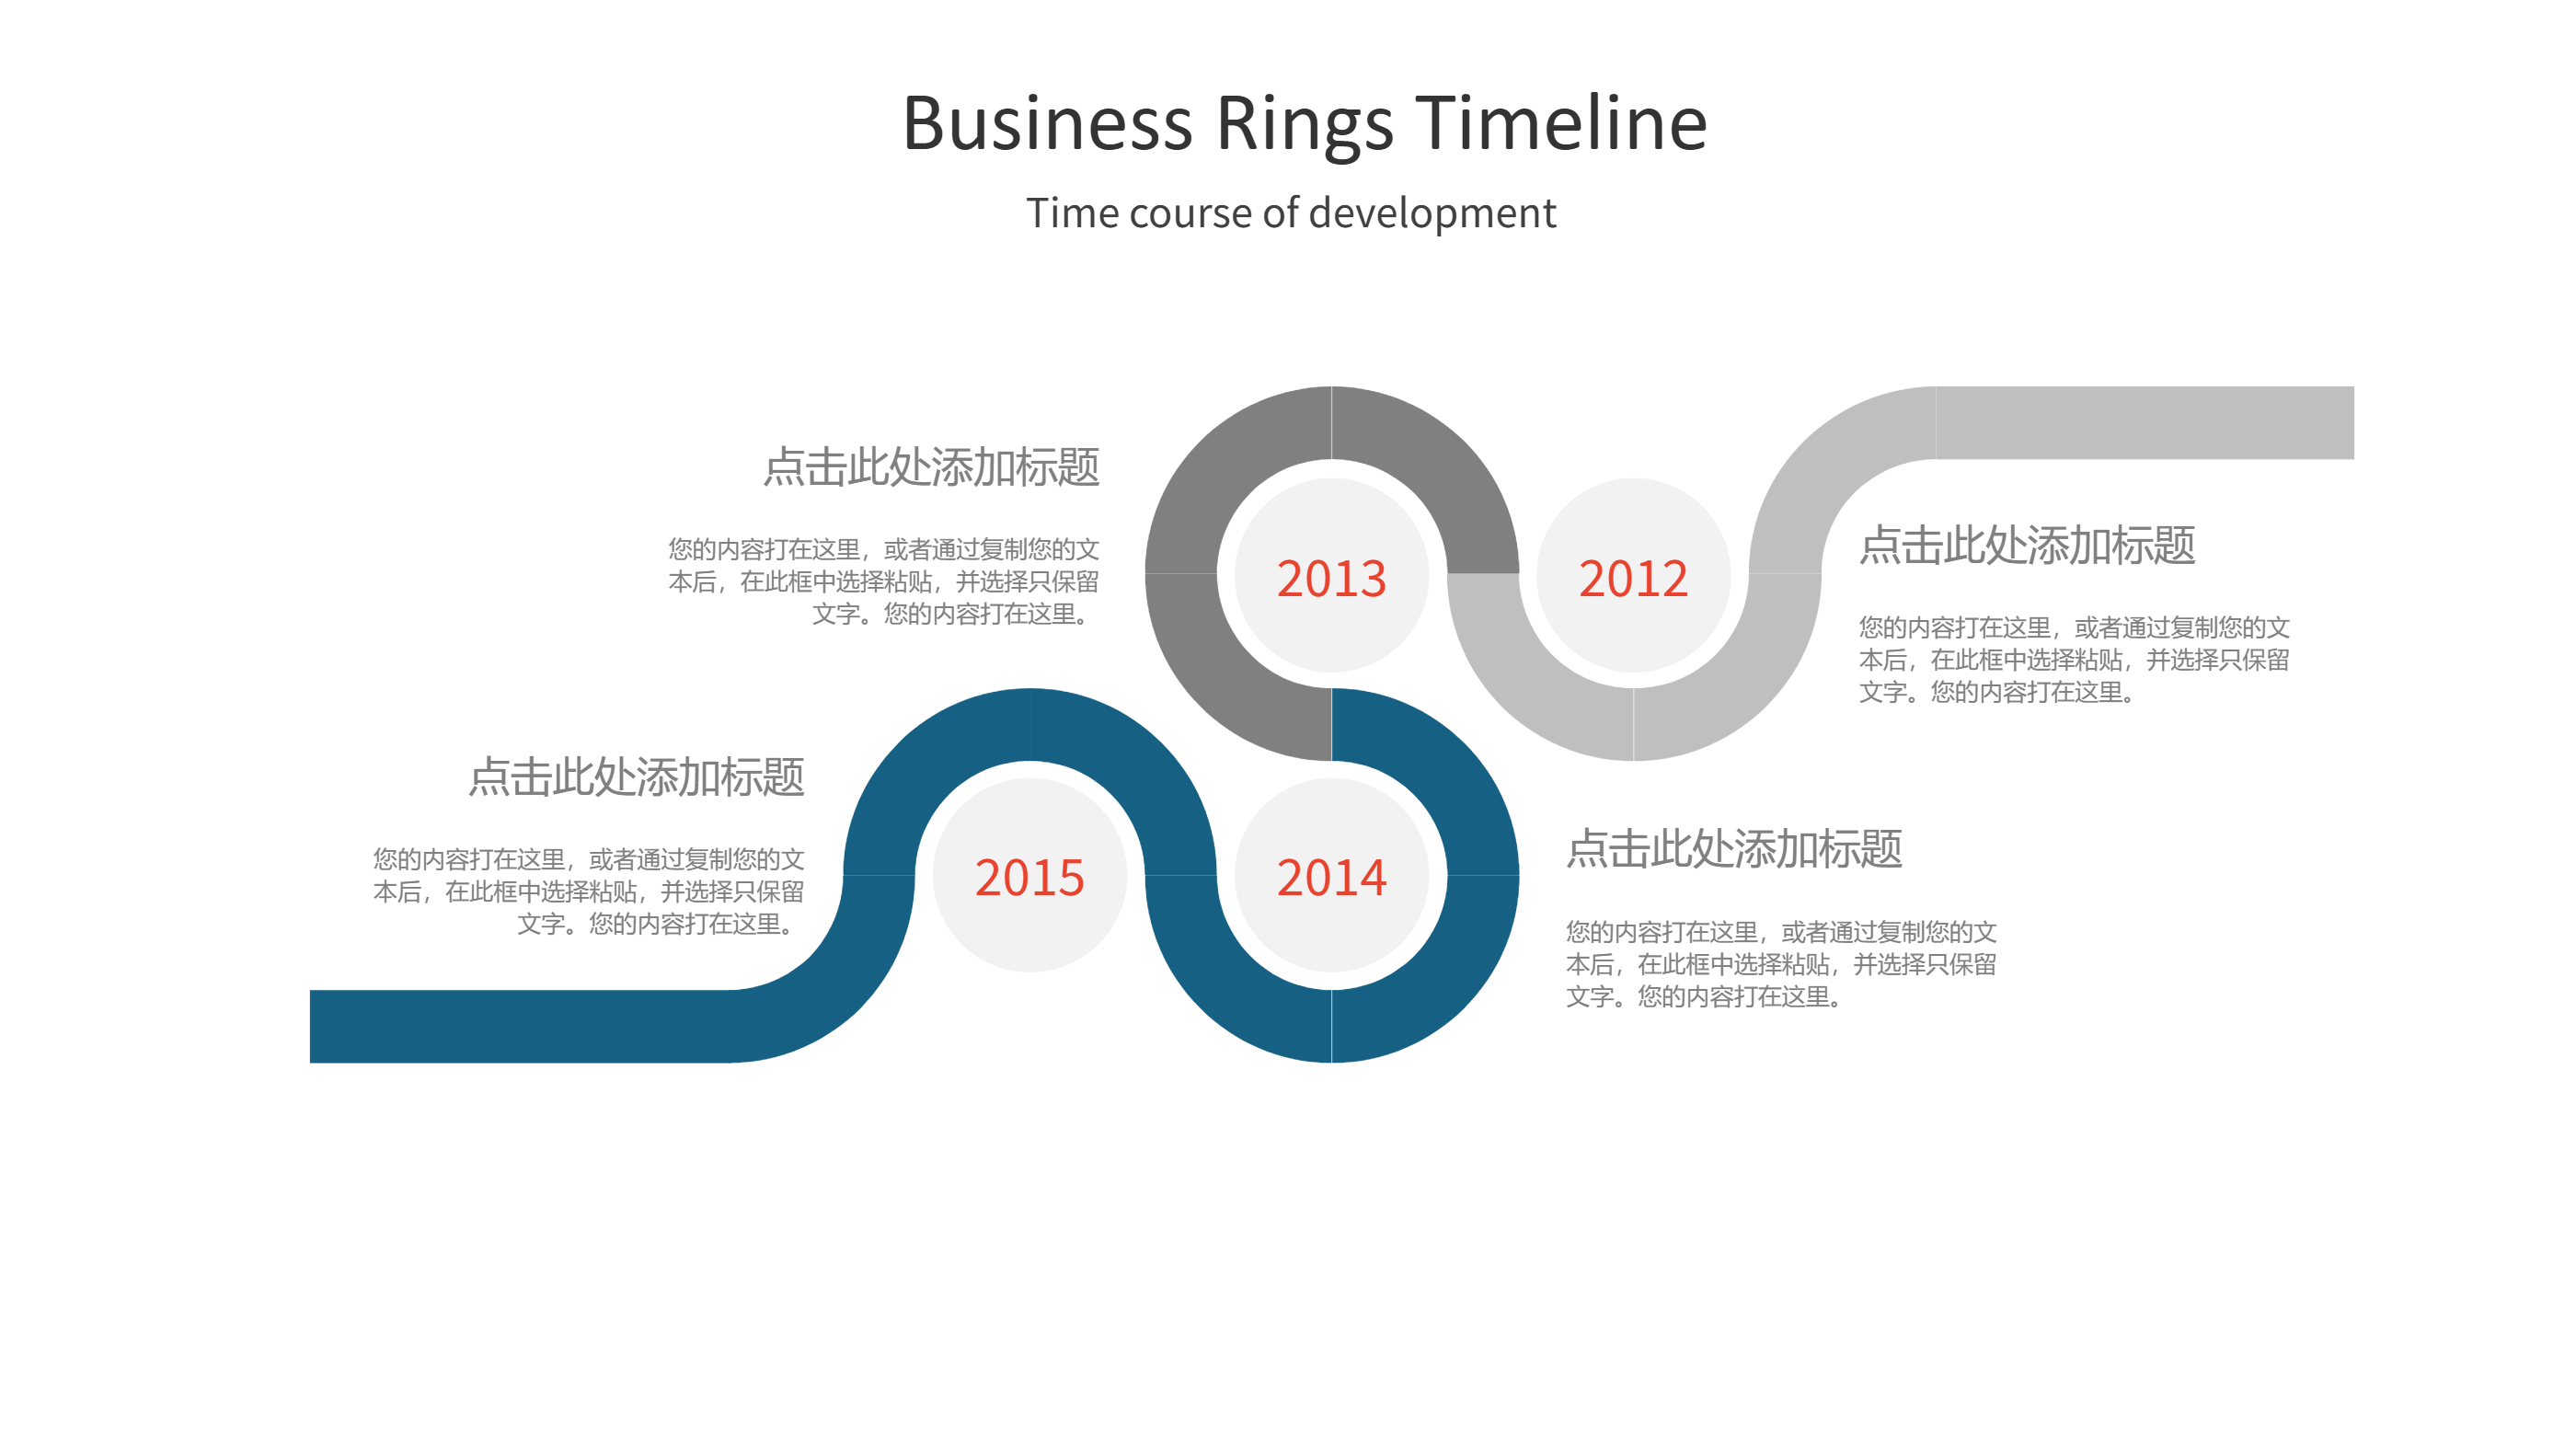
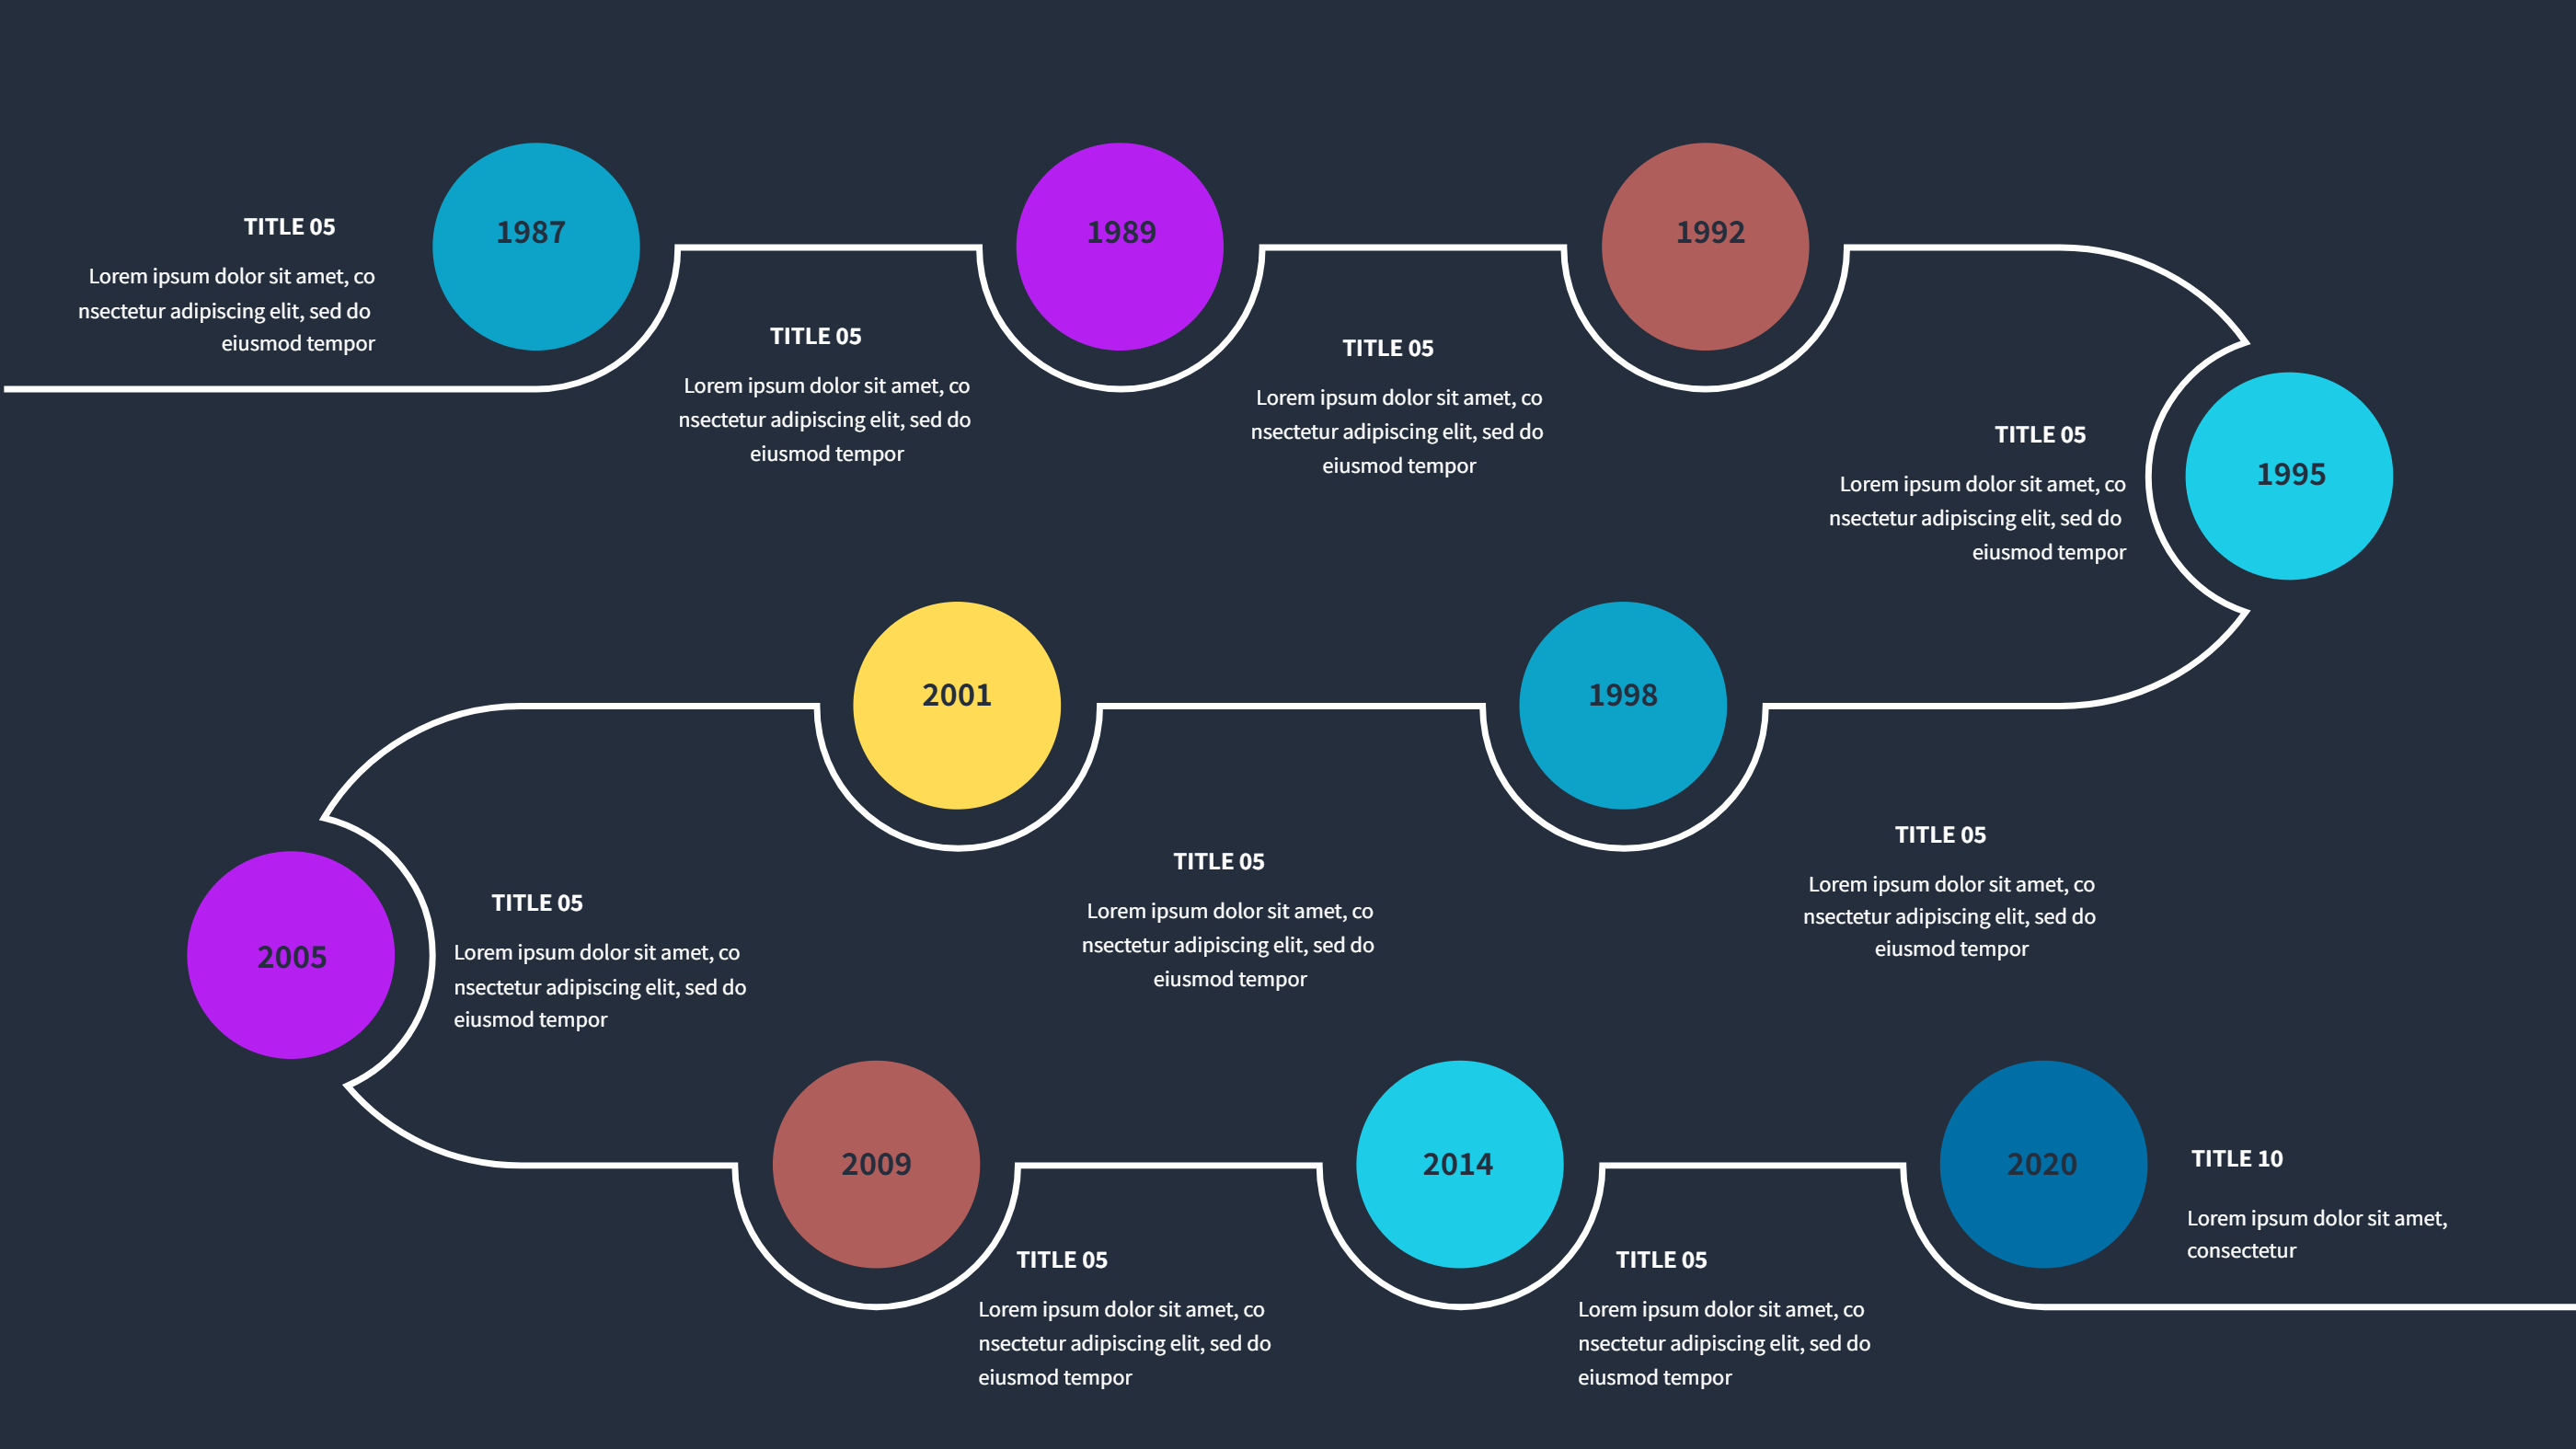
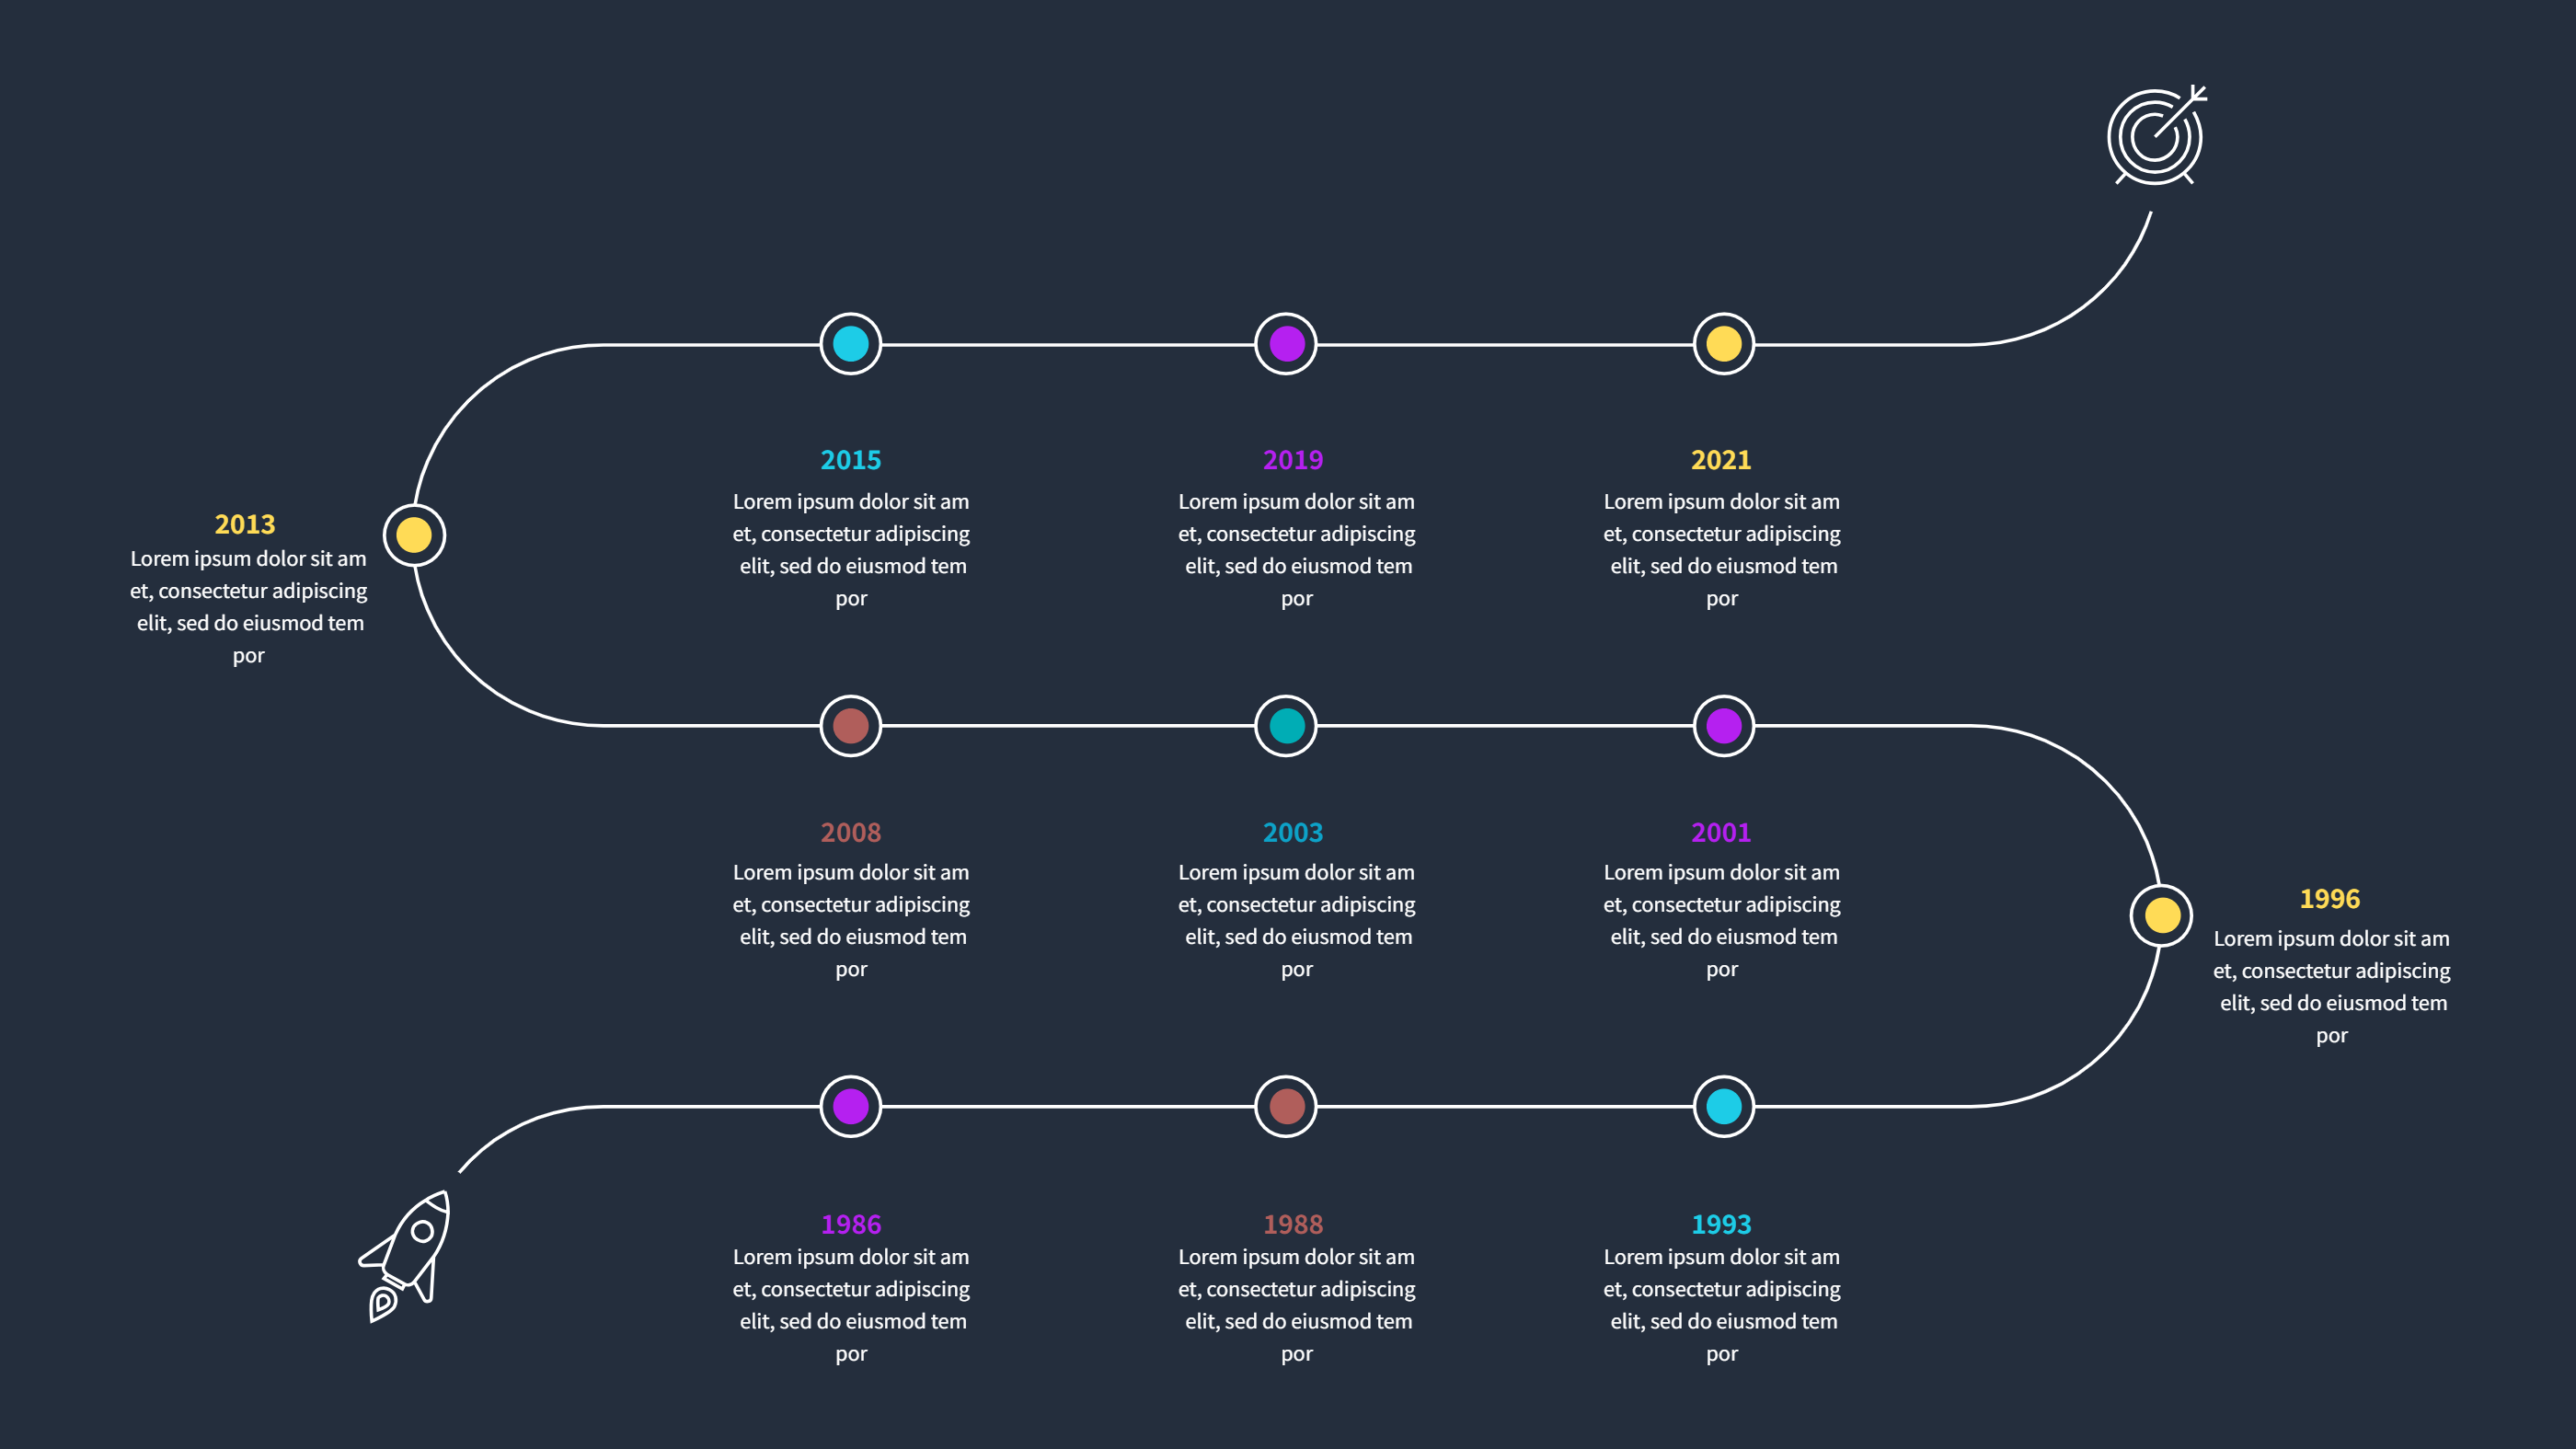
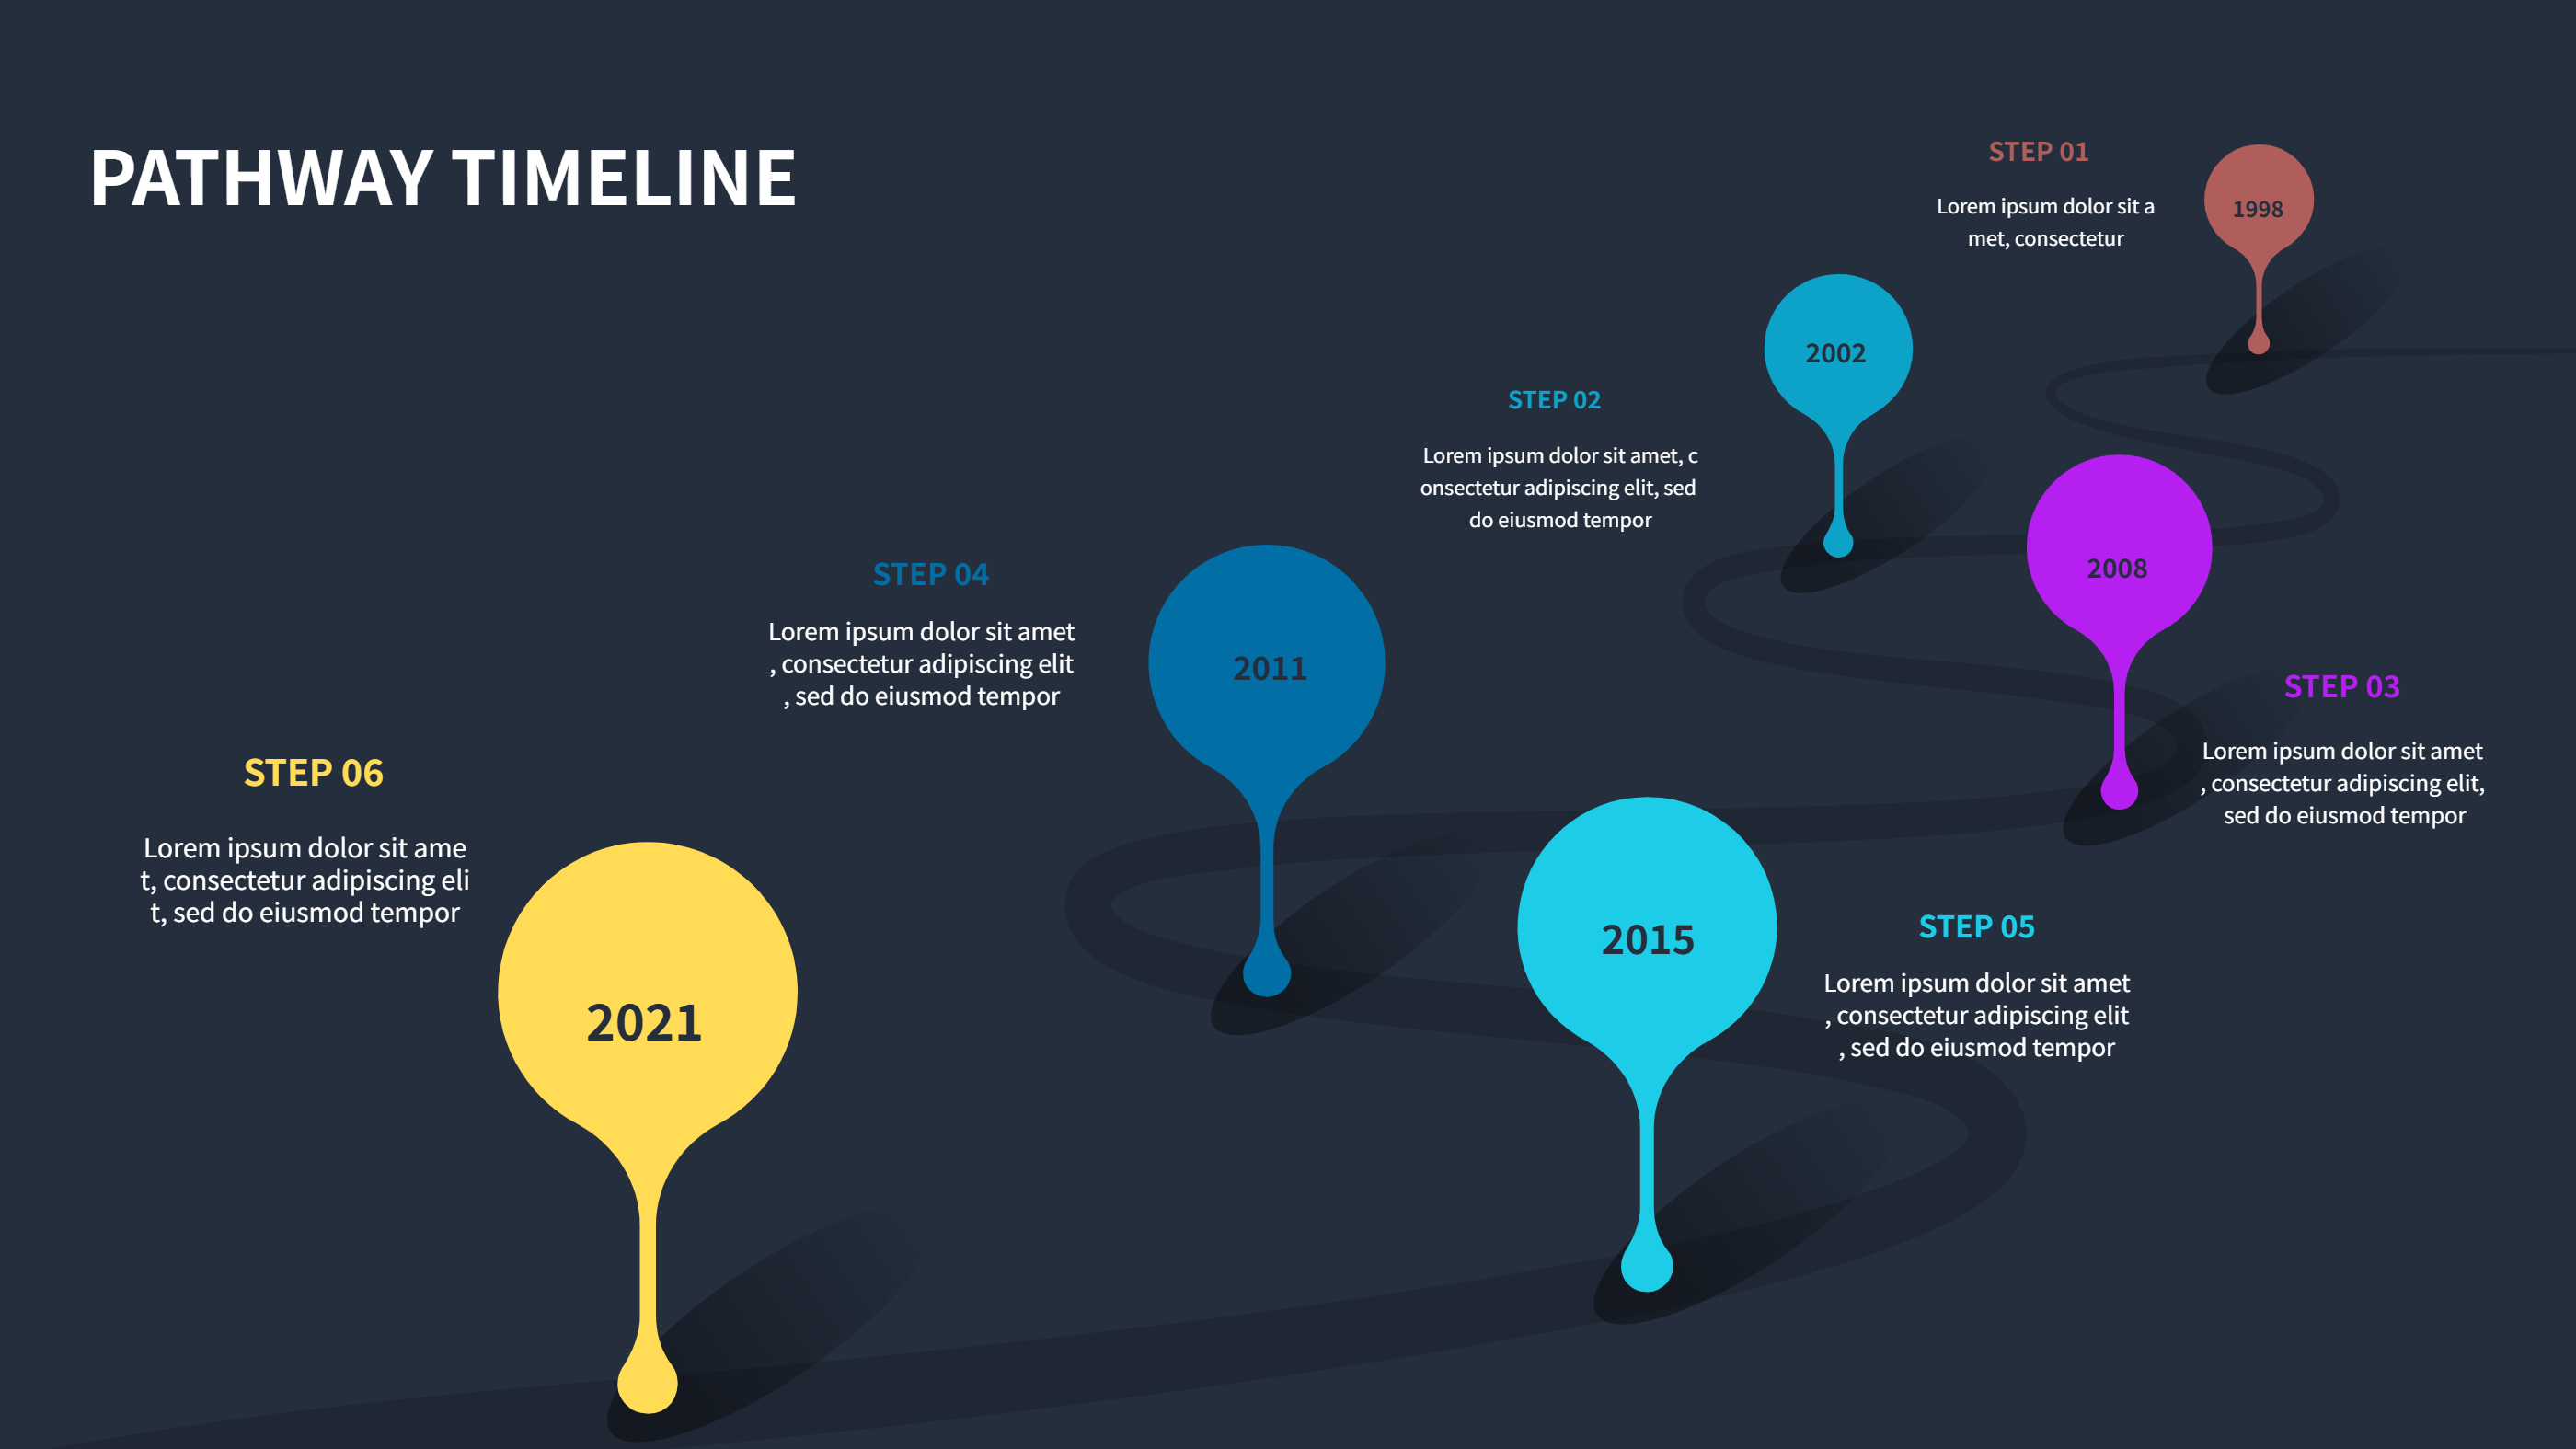
This timeline infographics template uses a stepped line to highlight milestones that rise and dip across the page. It suits stories with shifts in focus, alternating teams, or highs and lows over time. Each point has space for a date, a short label, and a brief note so the viewer sees what happened and why it matters.
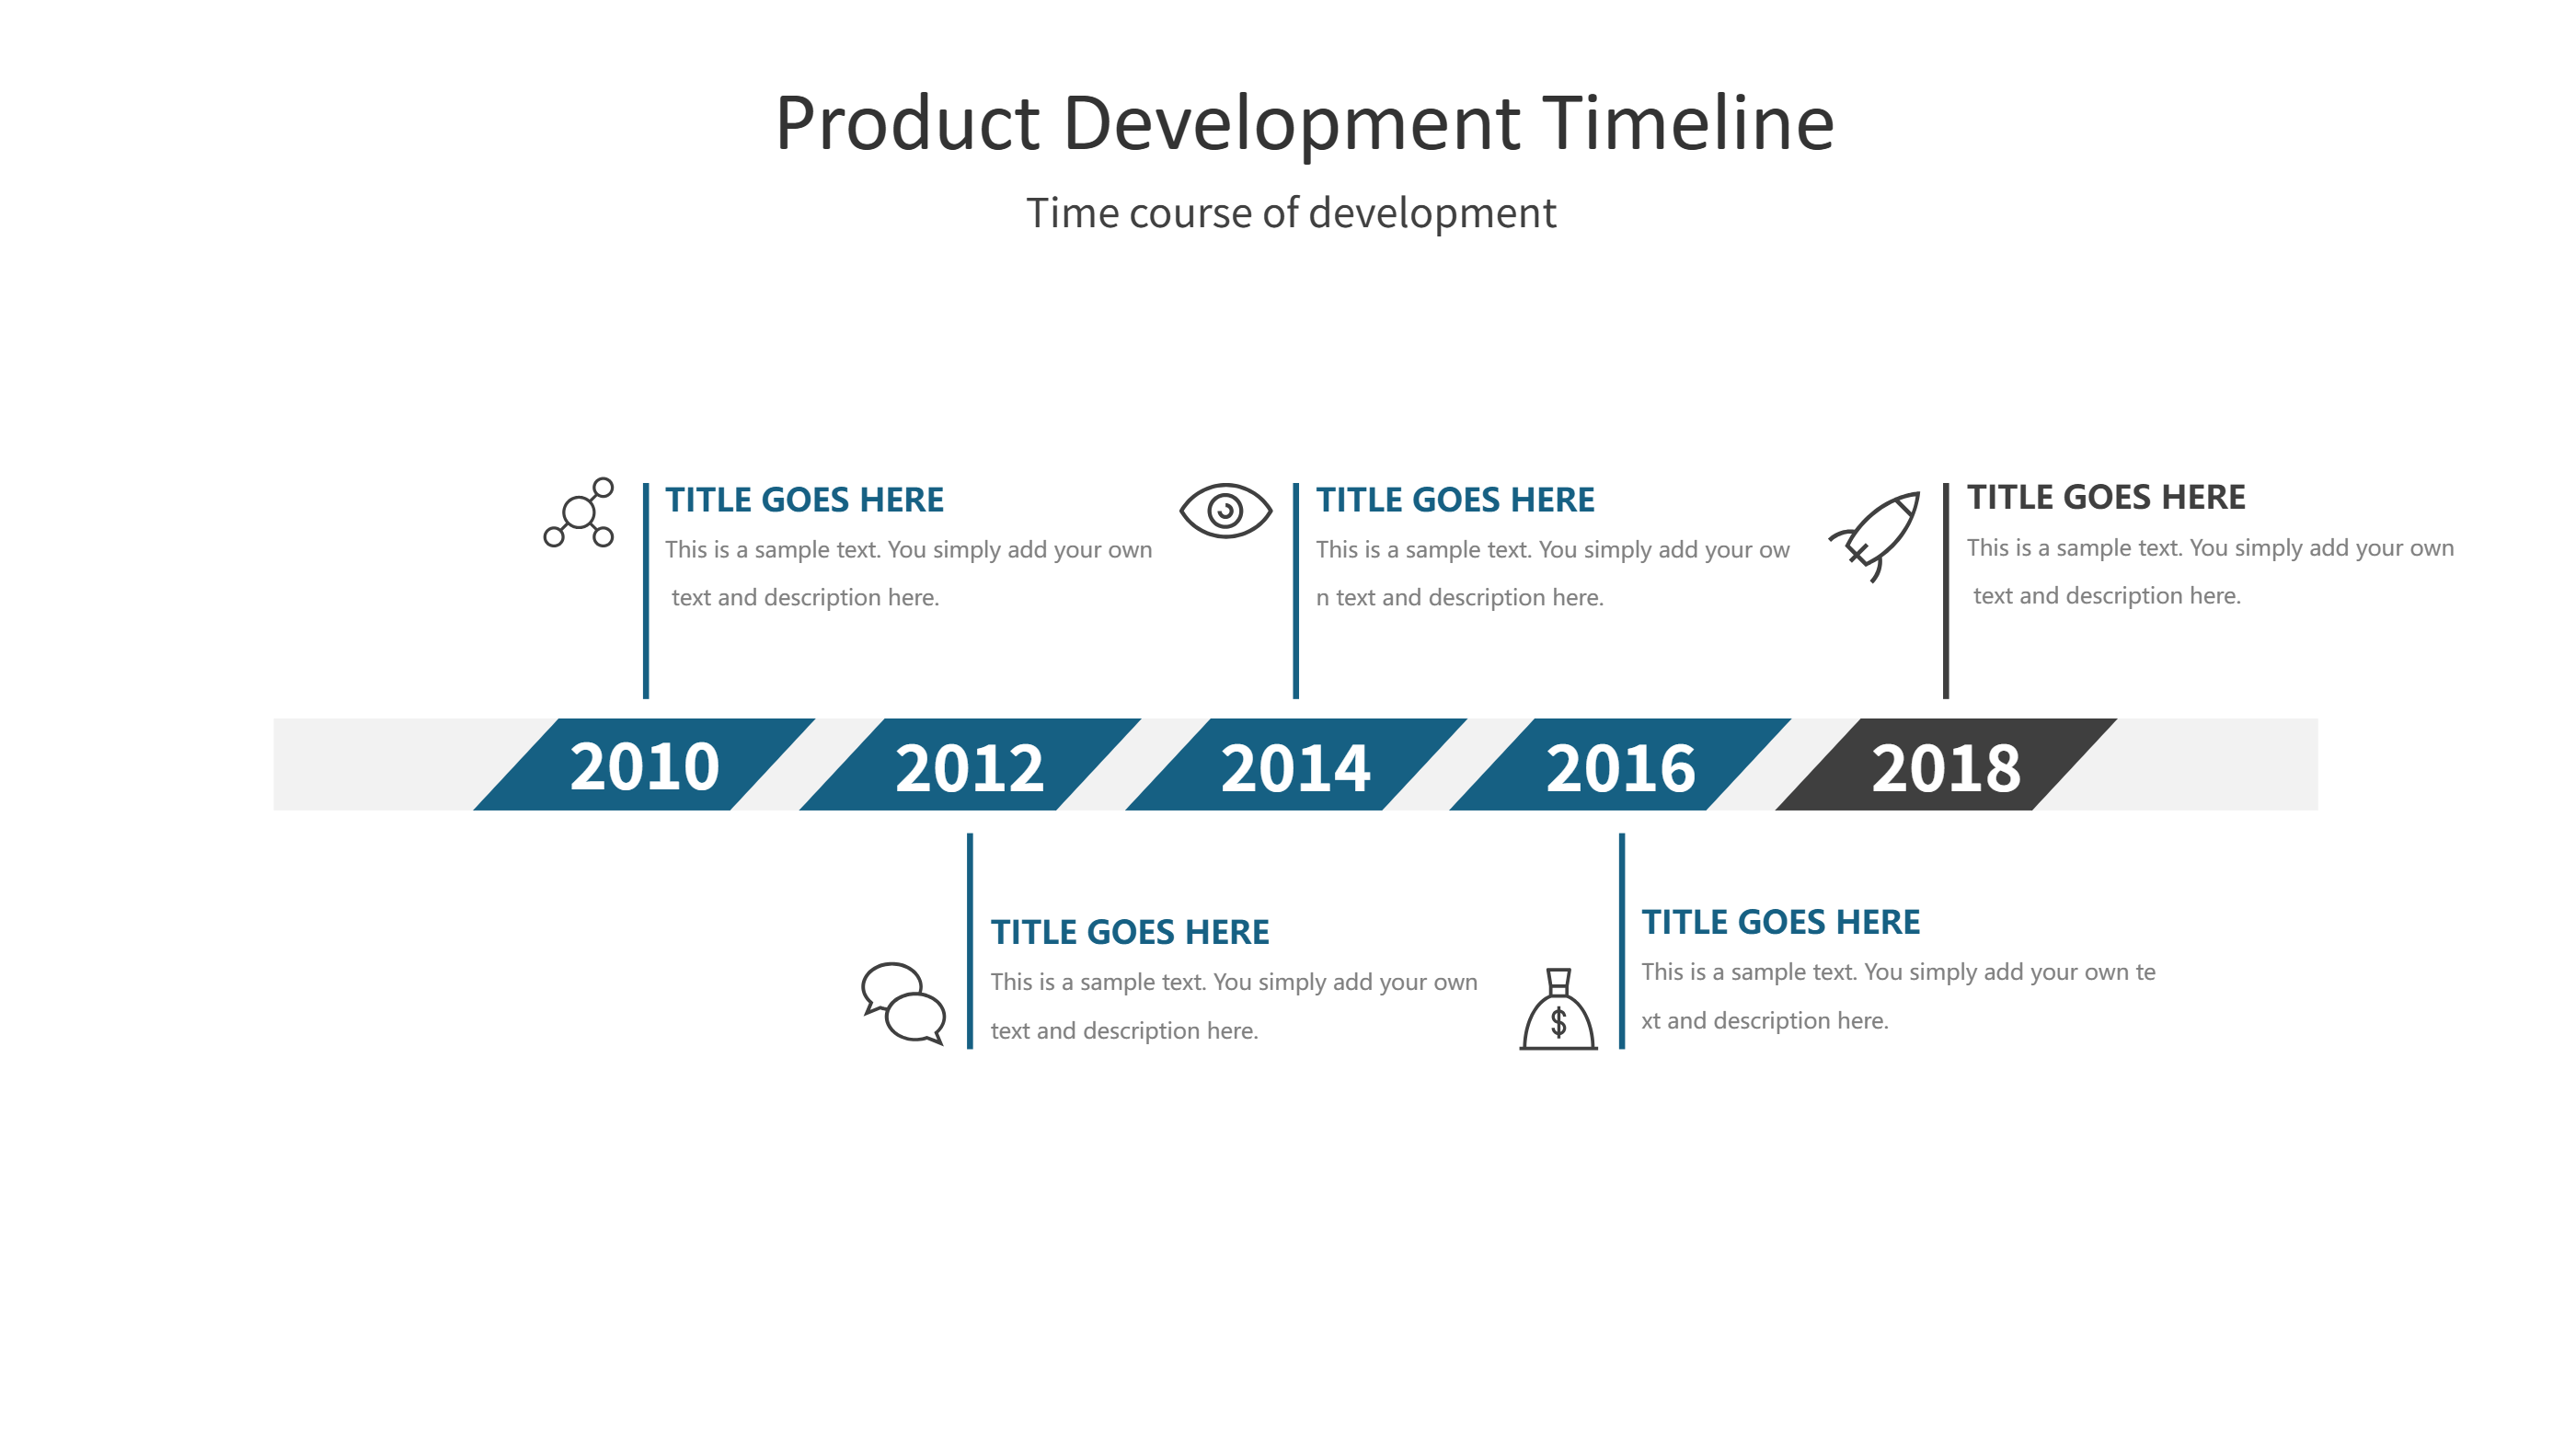
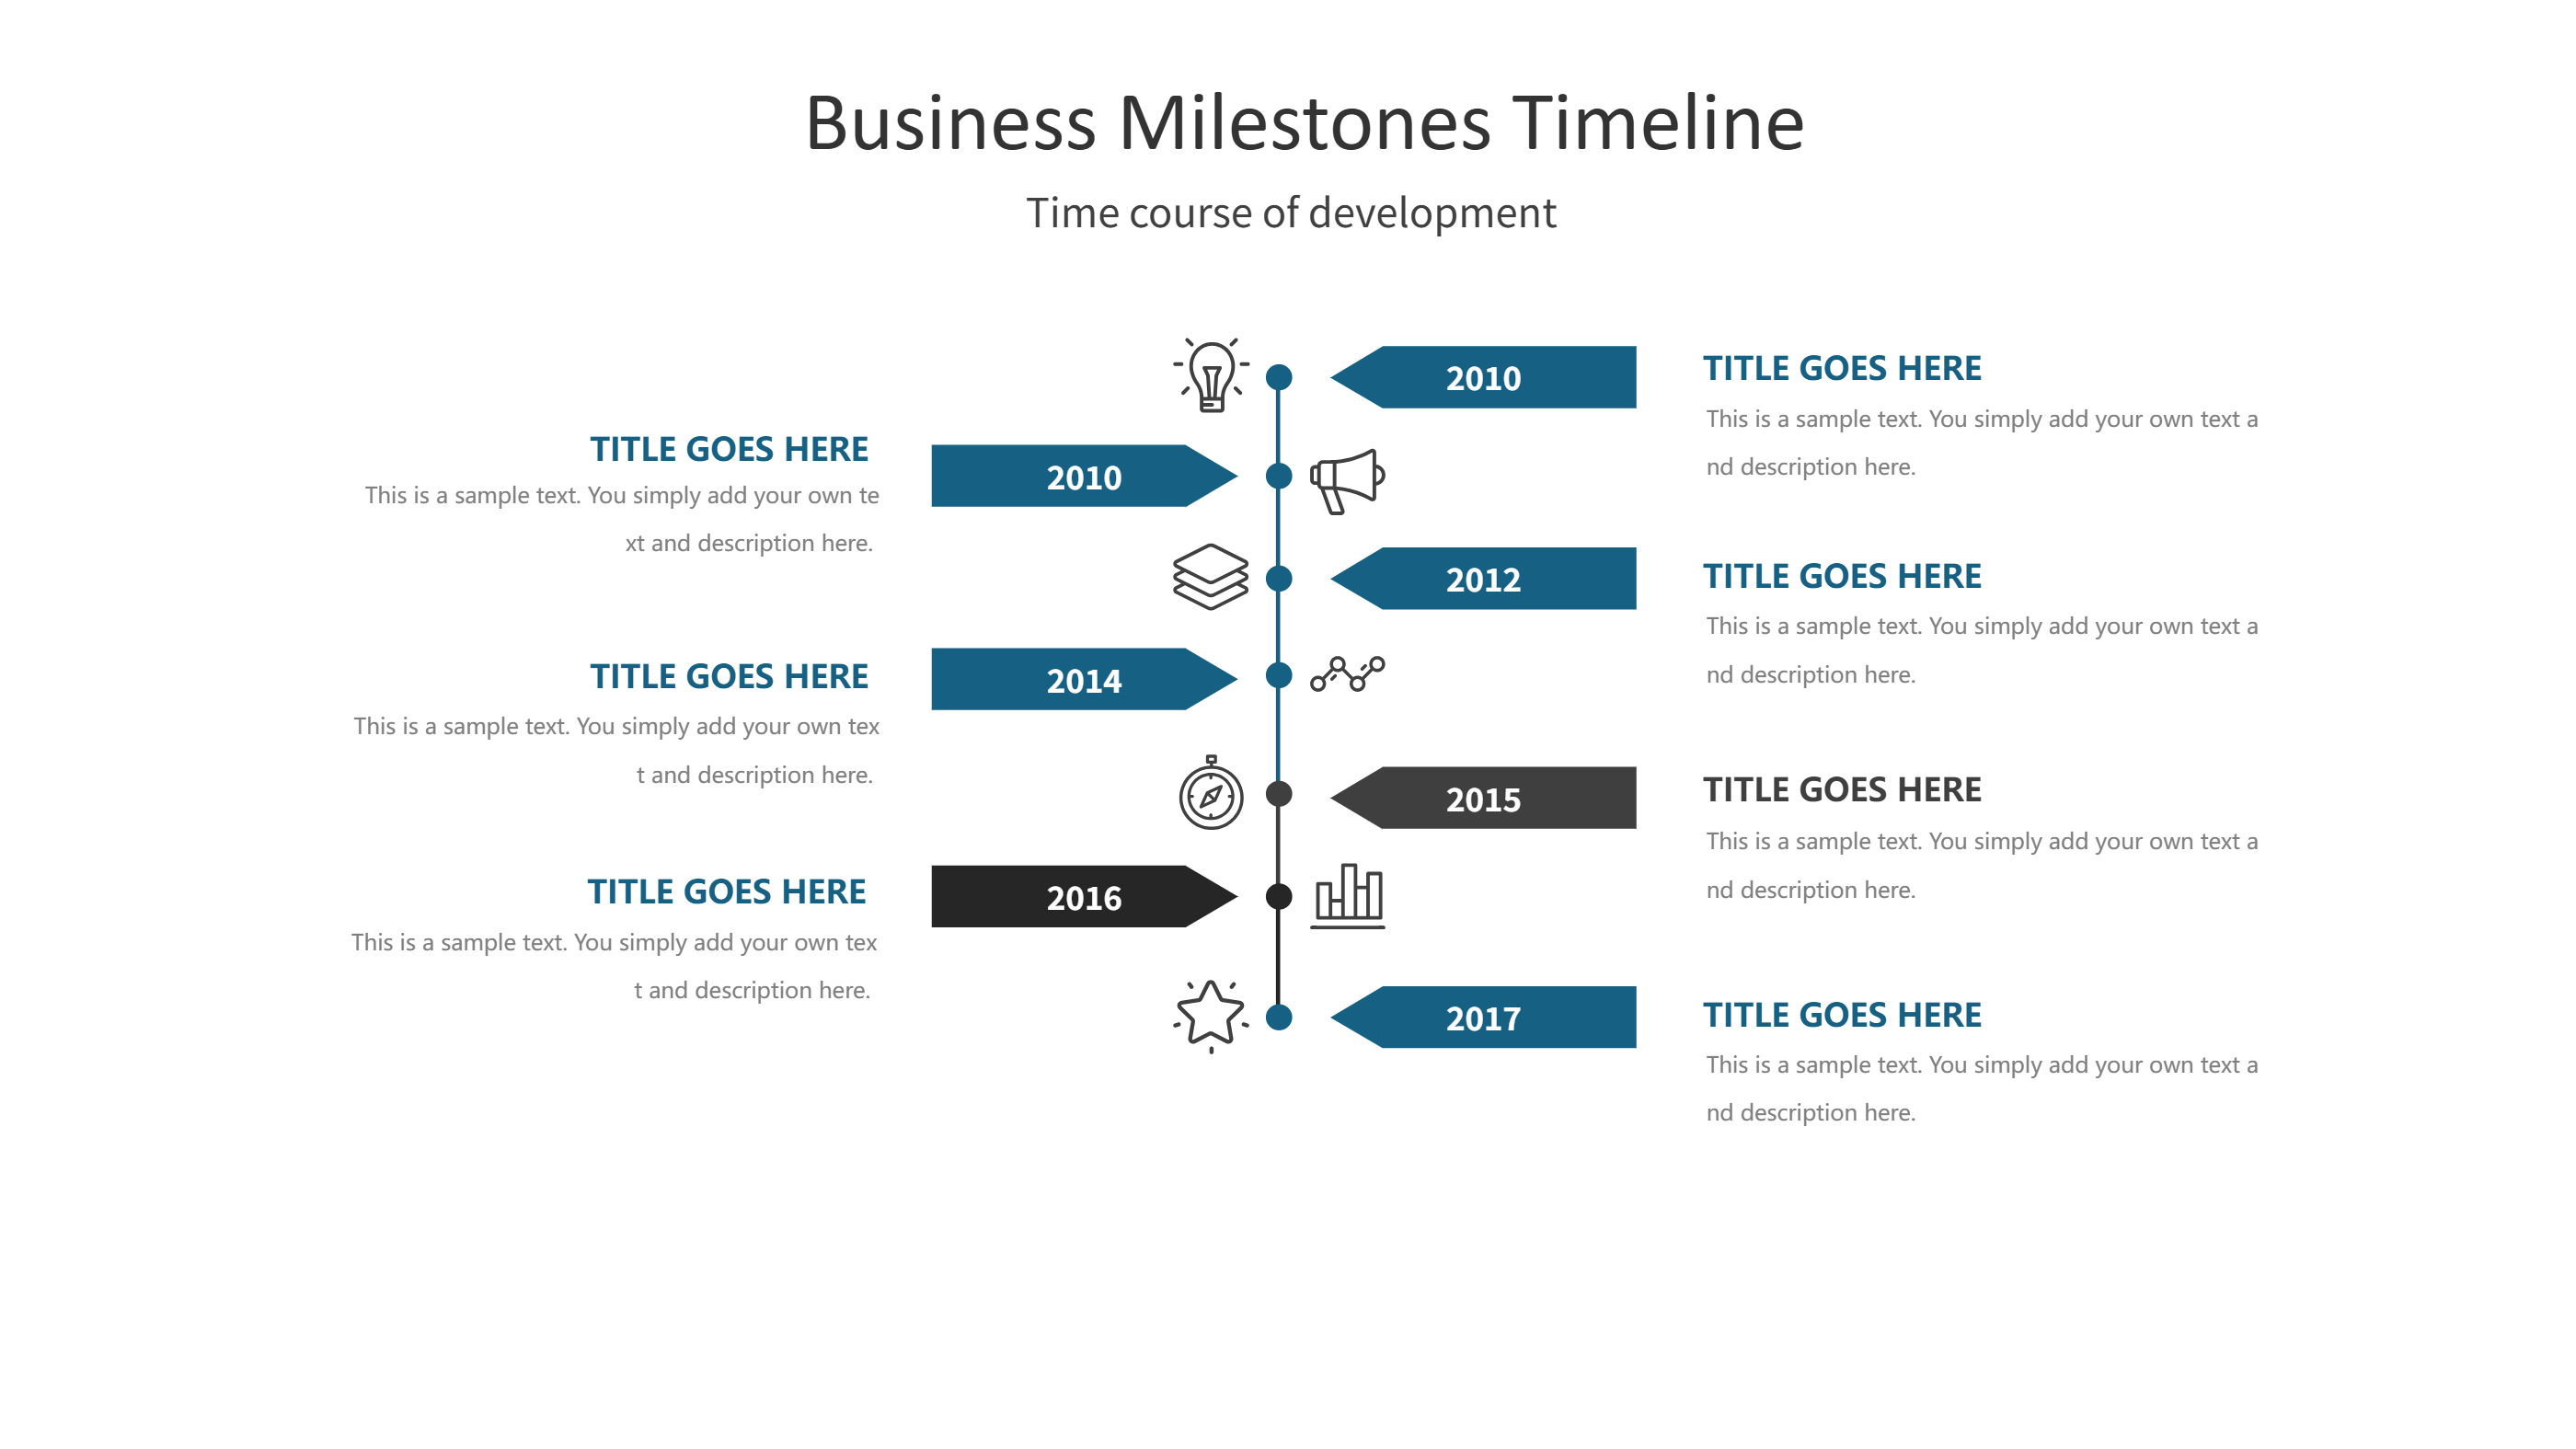
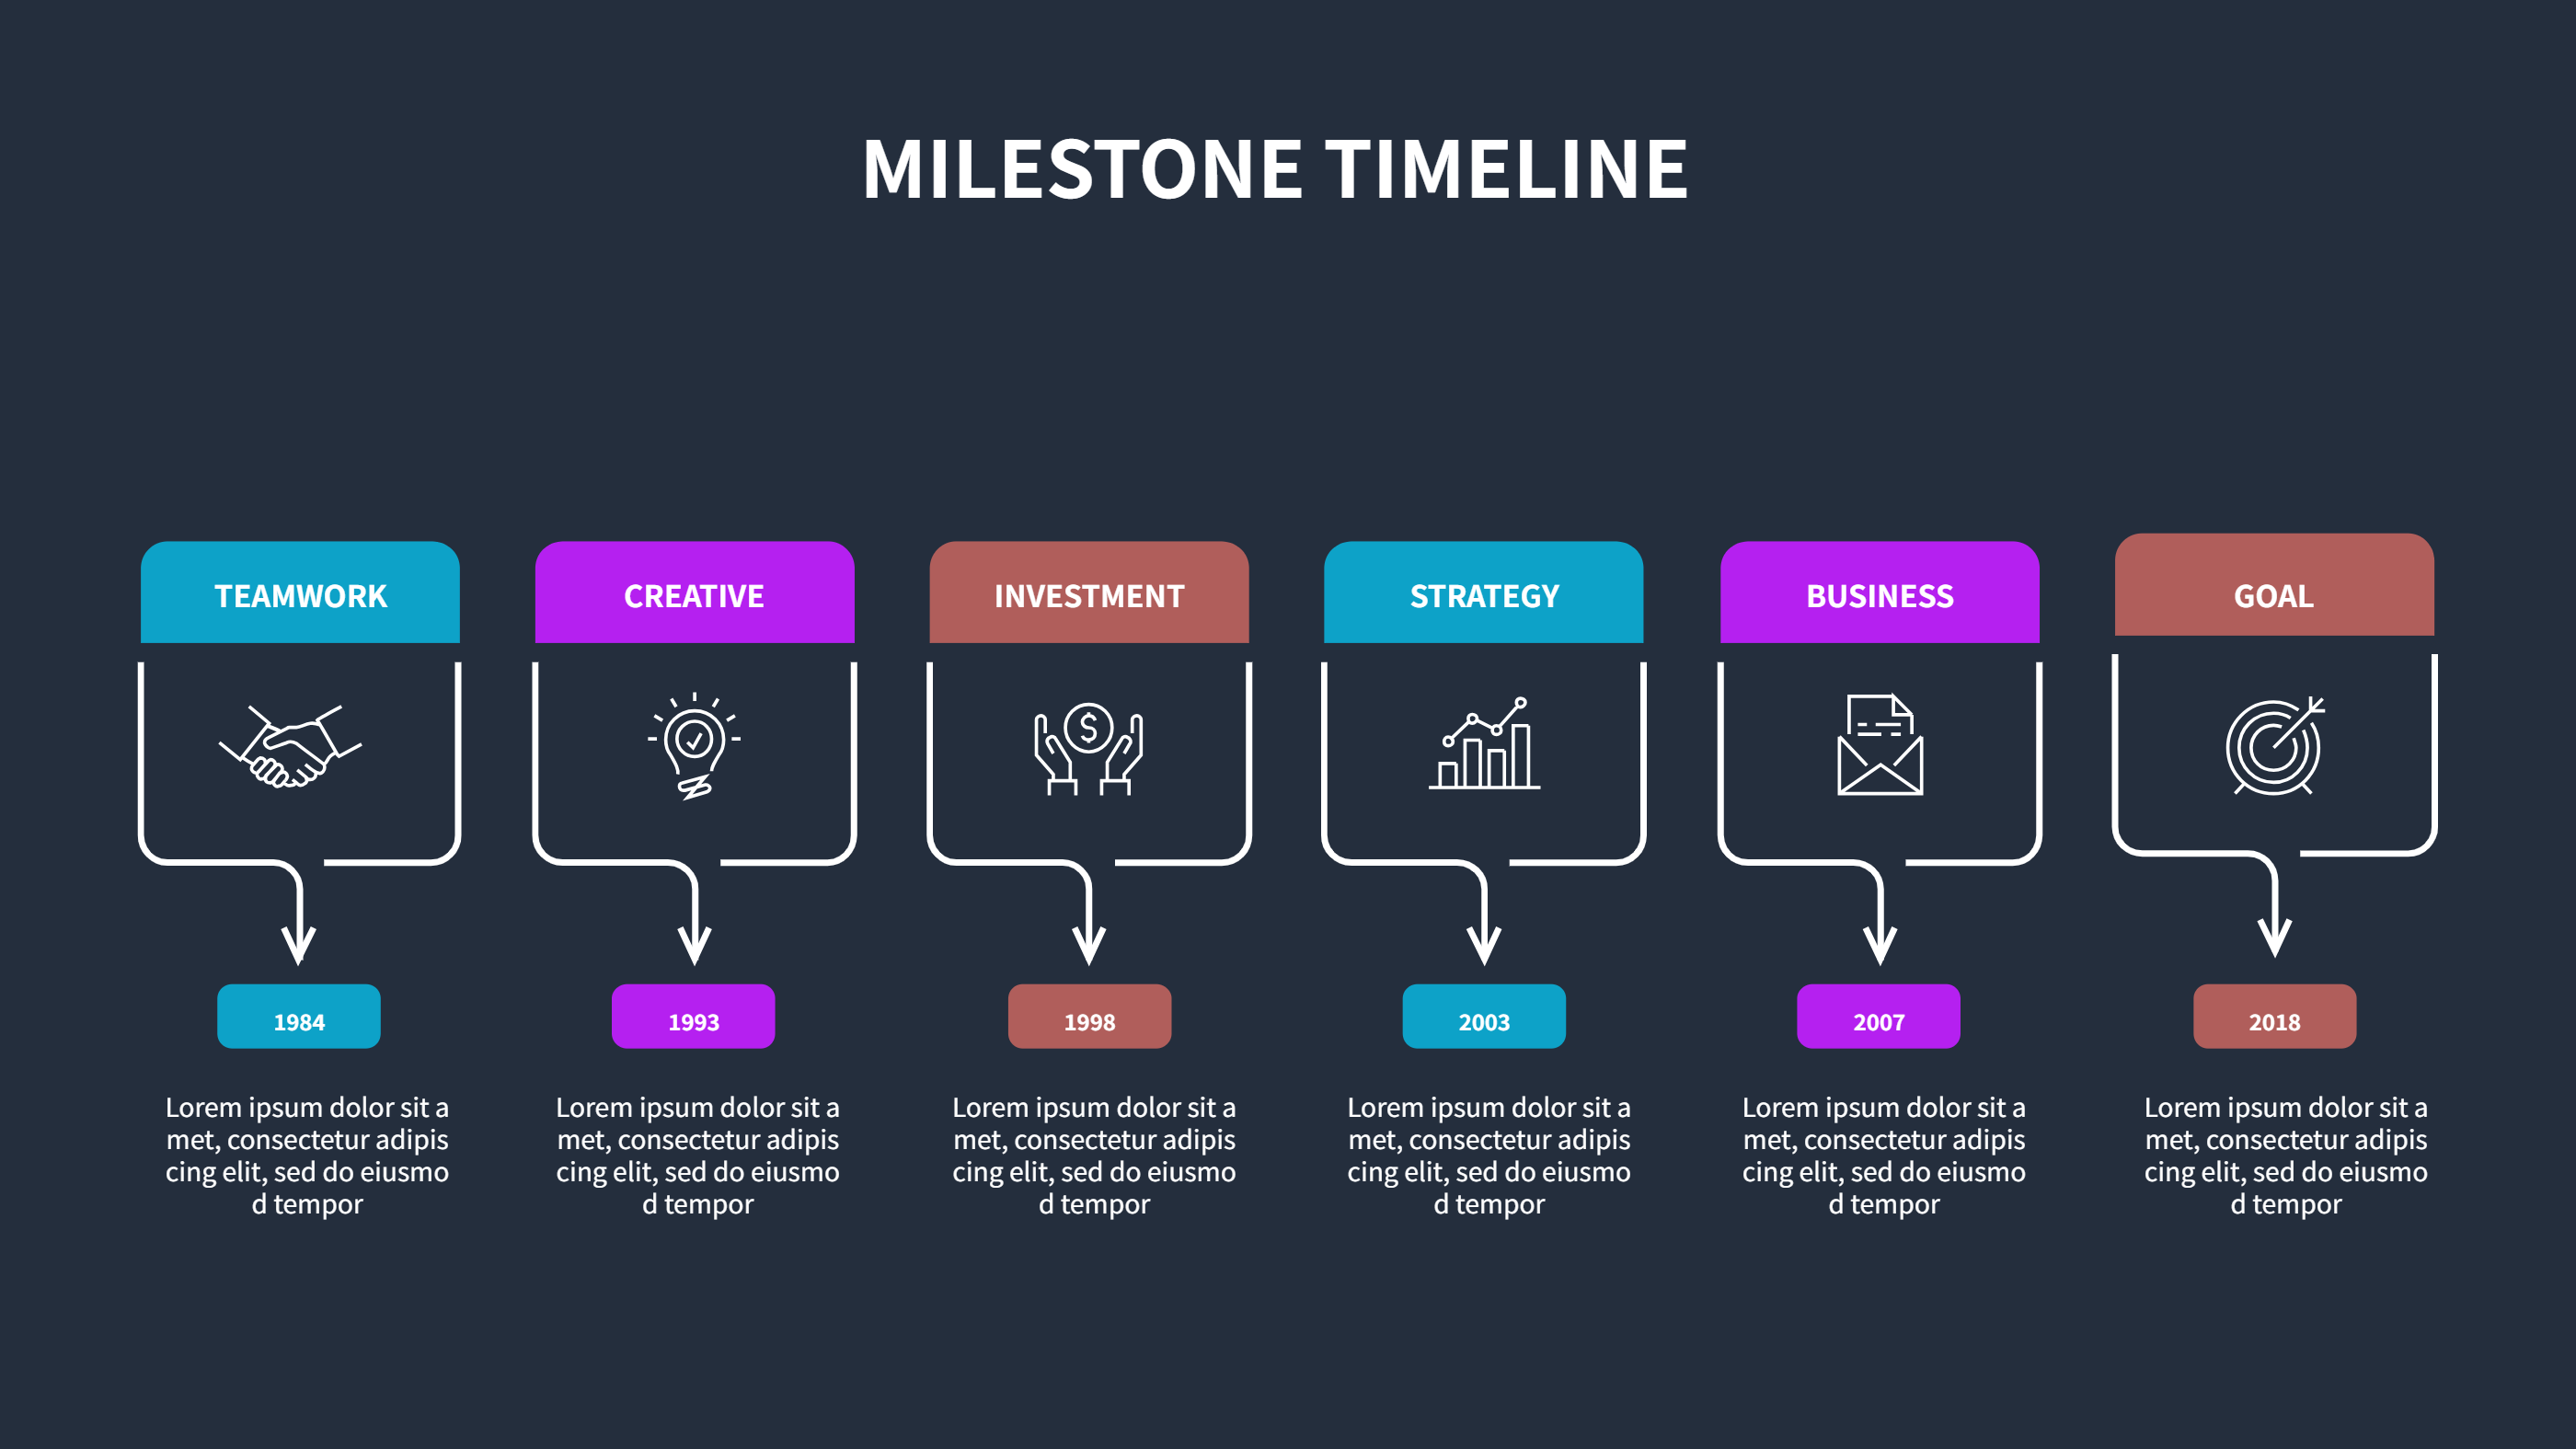
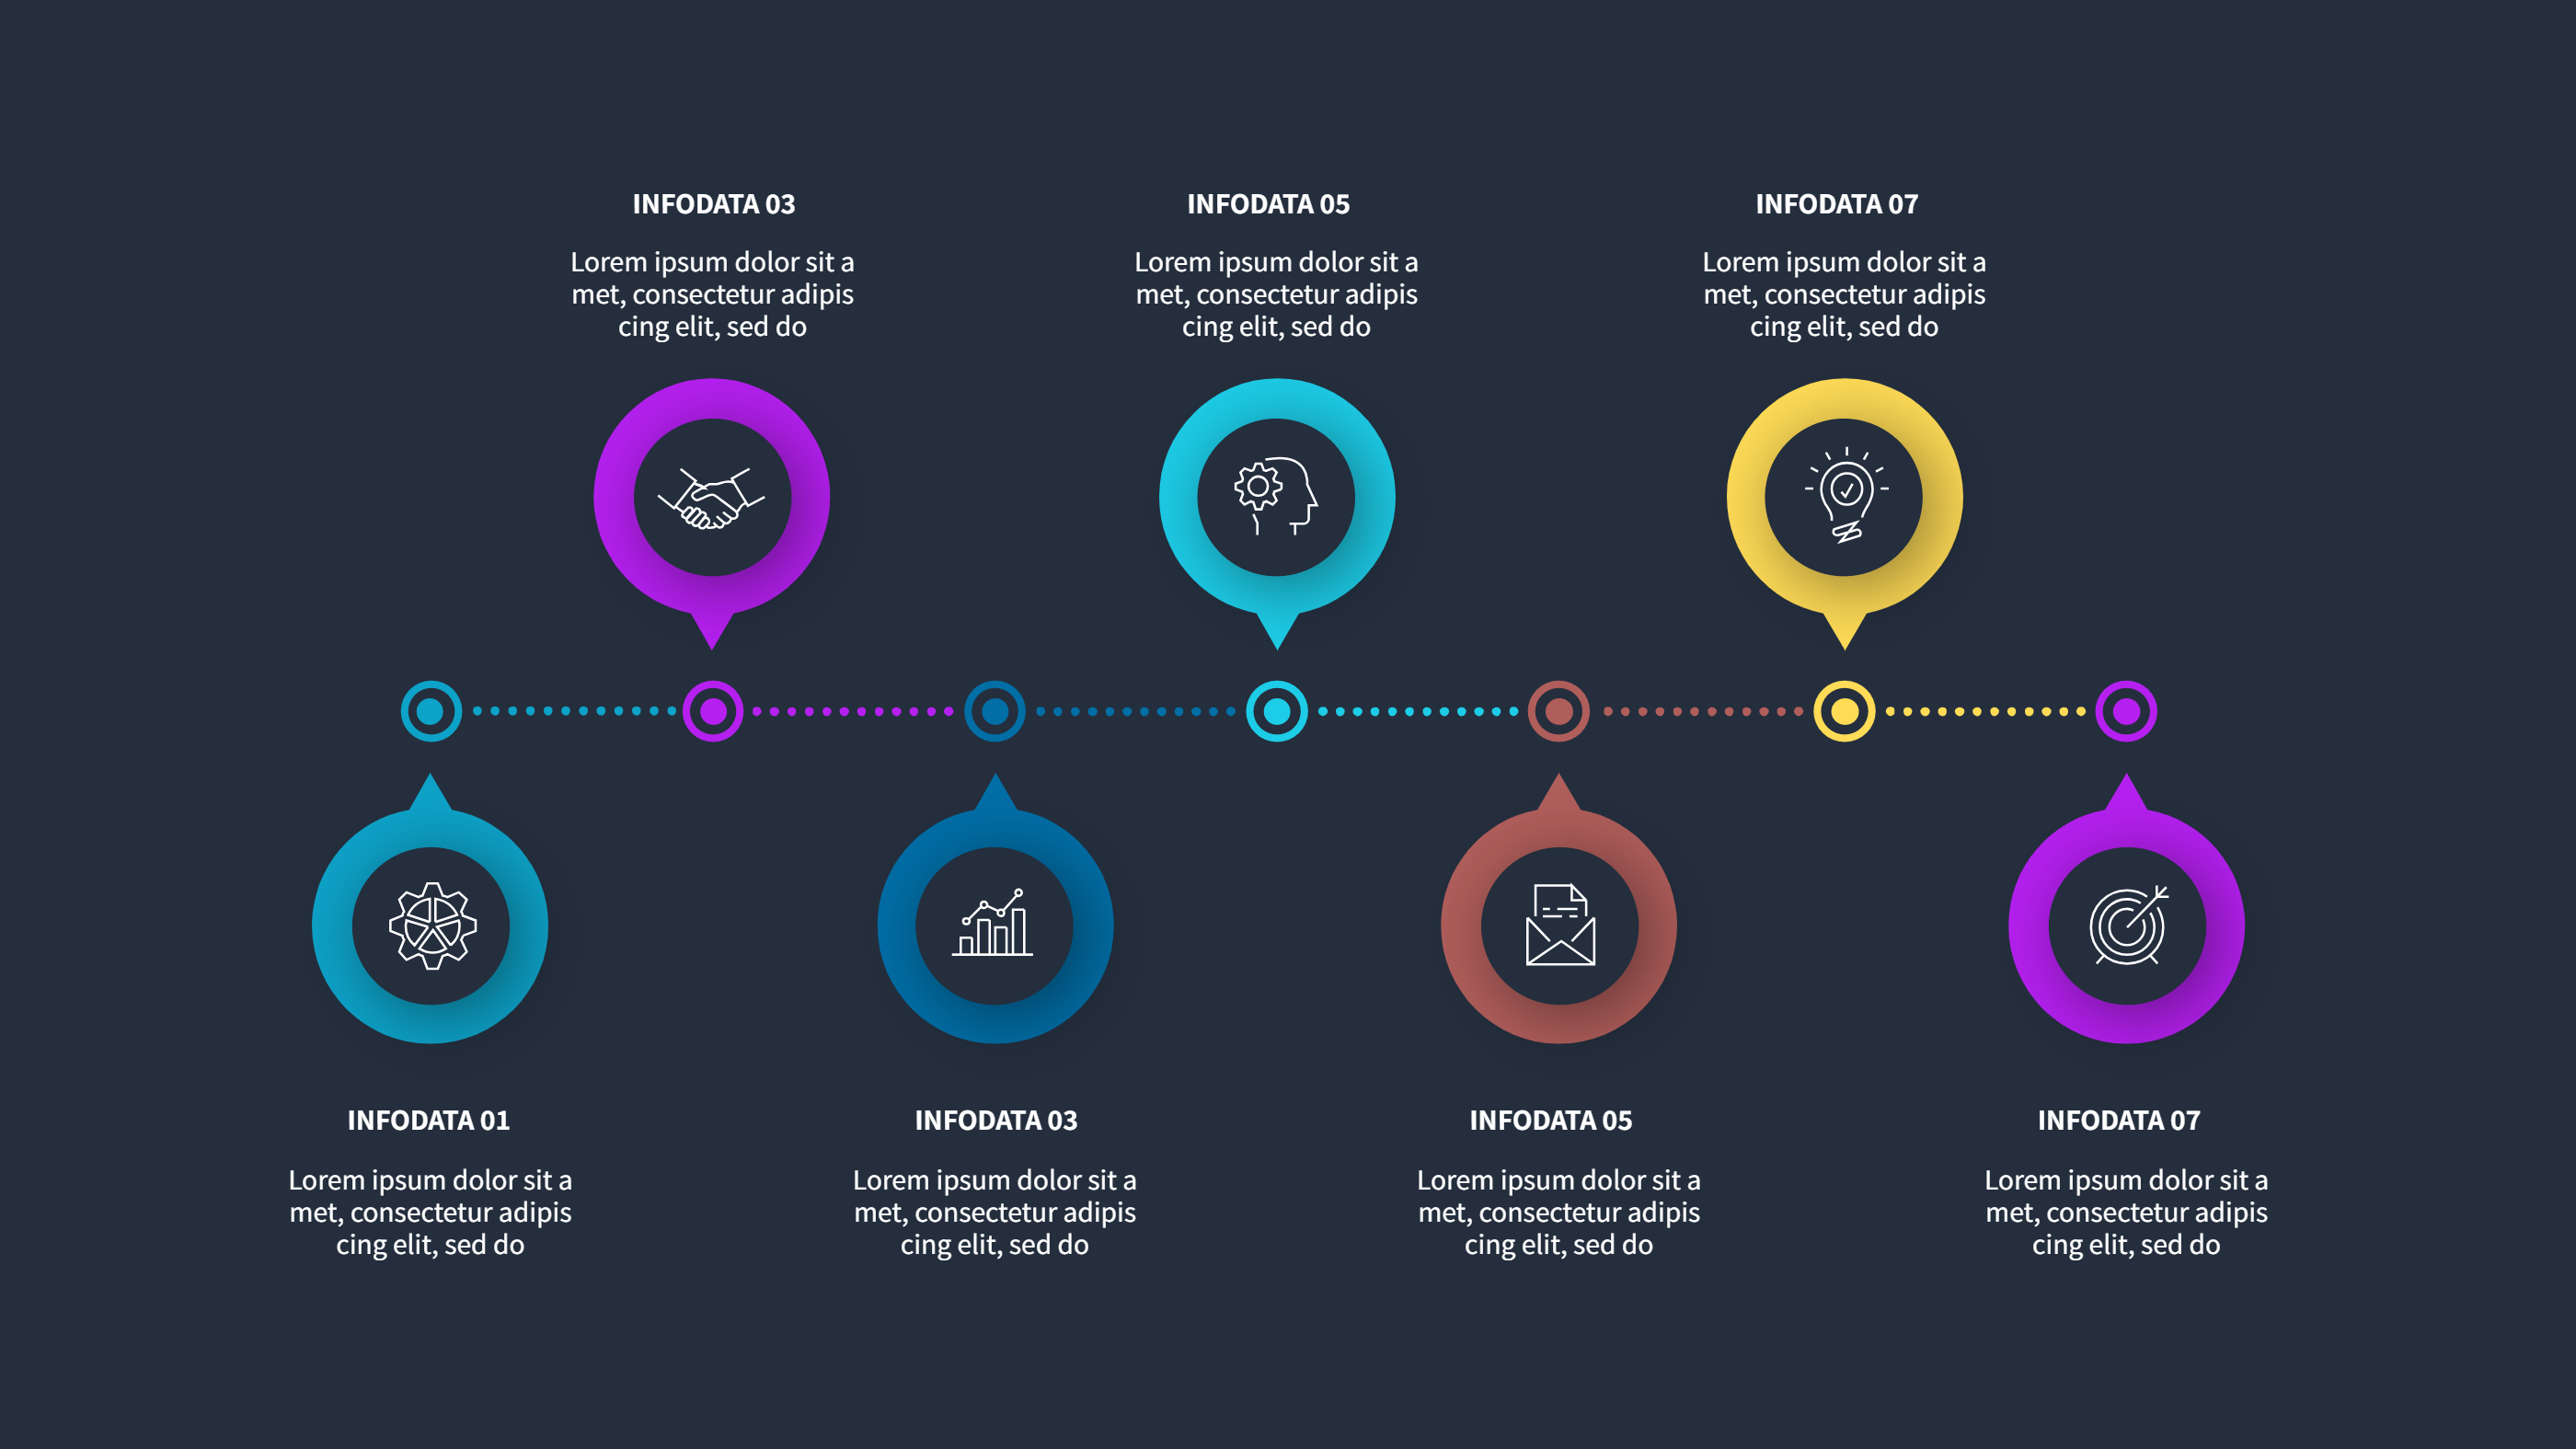
Keep text short and plain. Use color to group phases or owners. The alternating positions give you a way to call out big wins or risks without crowding the line. Swap in your own dates, rename the steps, and adjust colors to fit brand or category. The zigzag shape keeps attention moving from left to right without confusion. You can add a small legend if you want to explain what each color means.
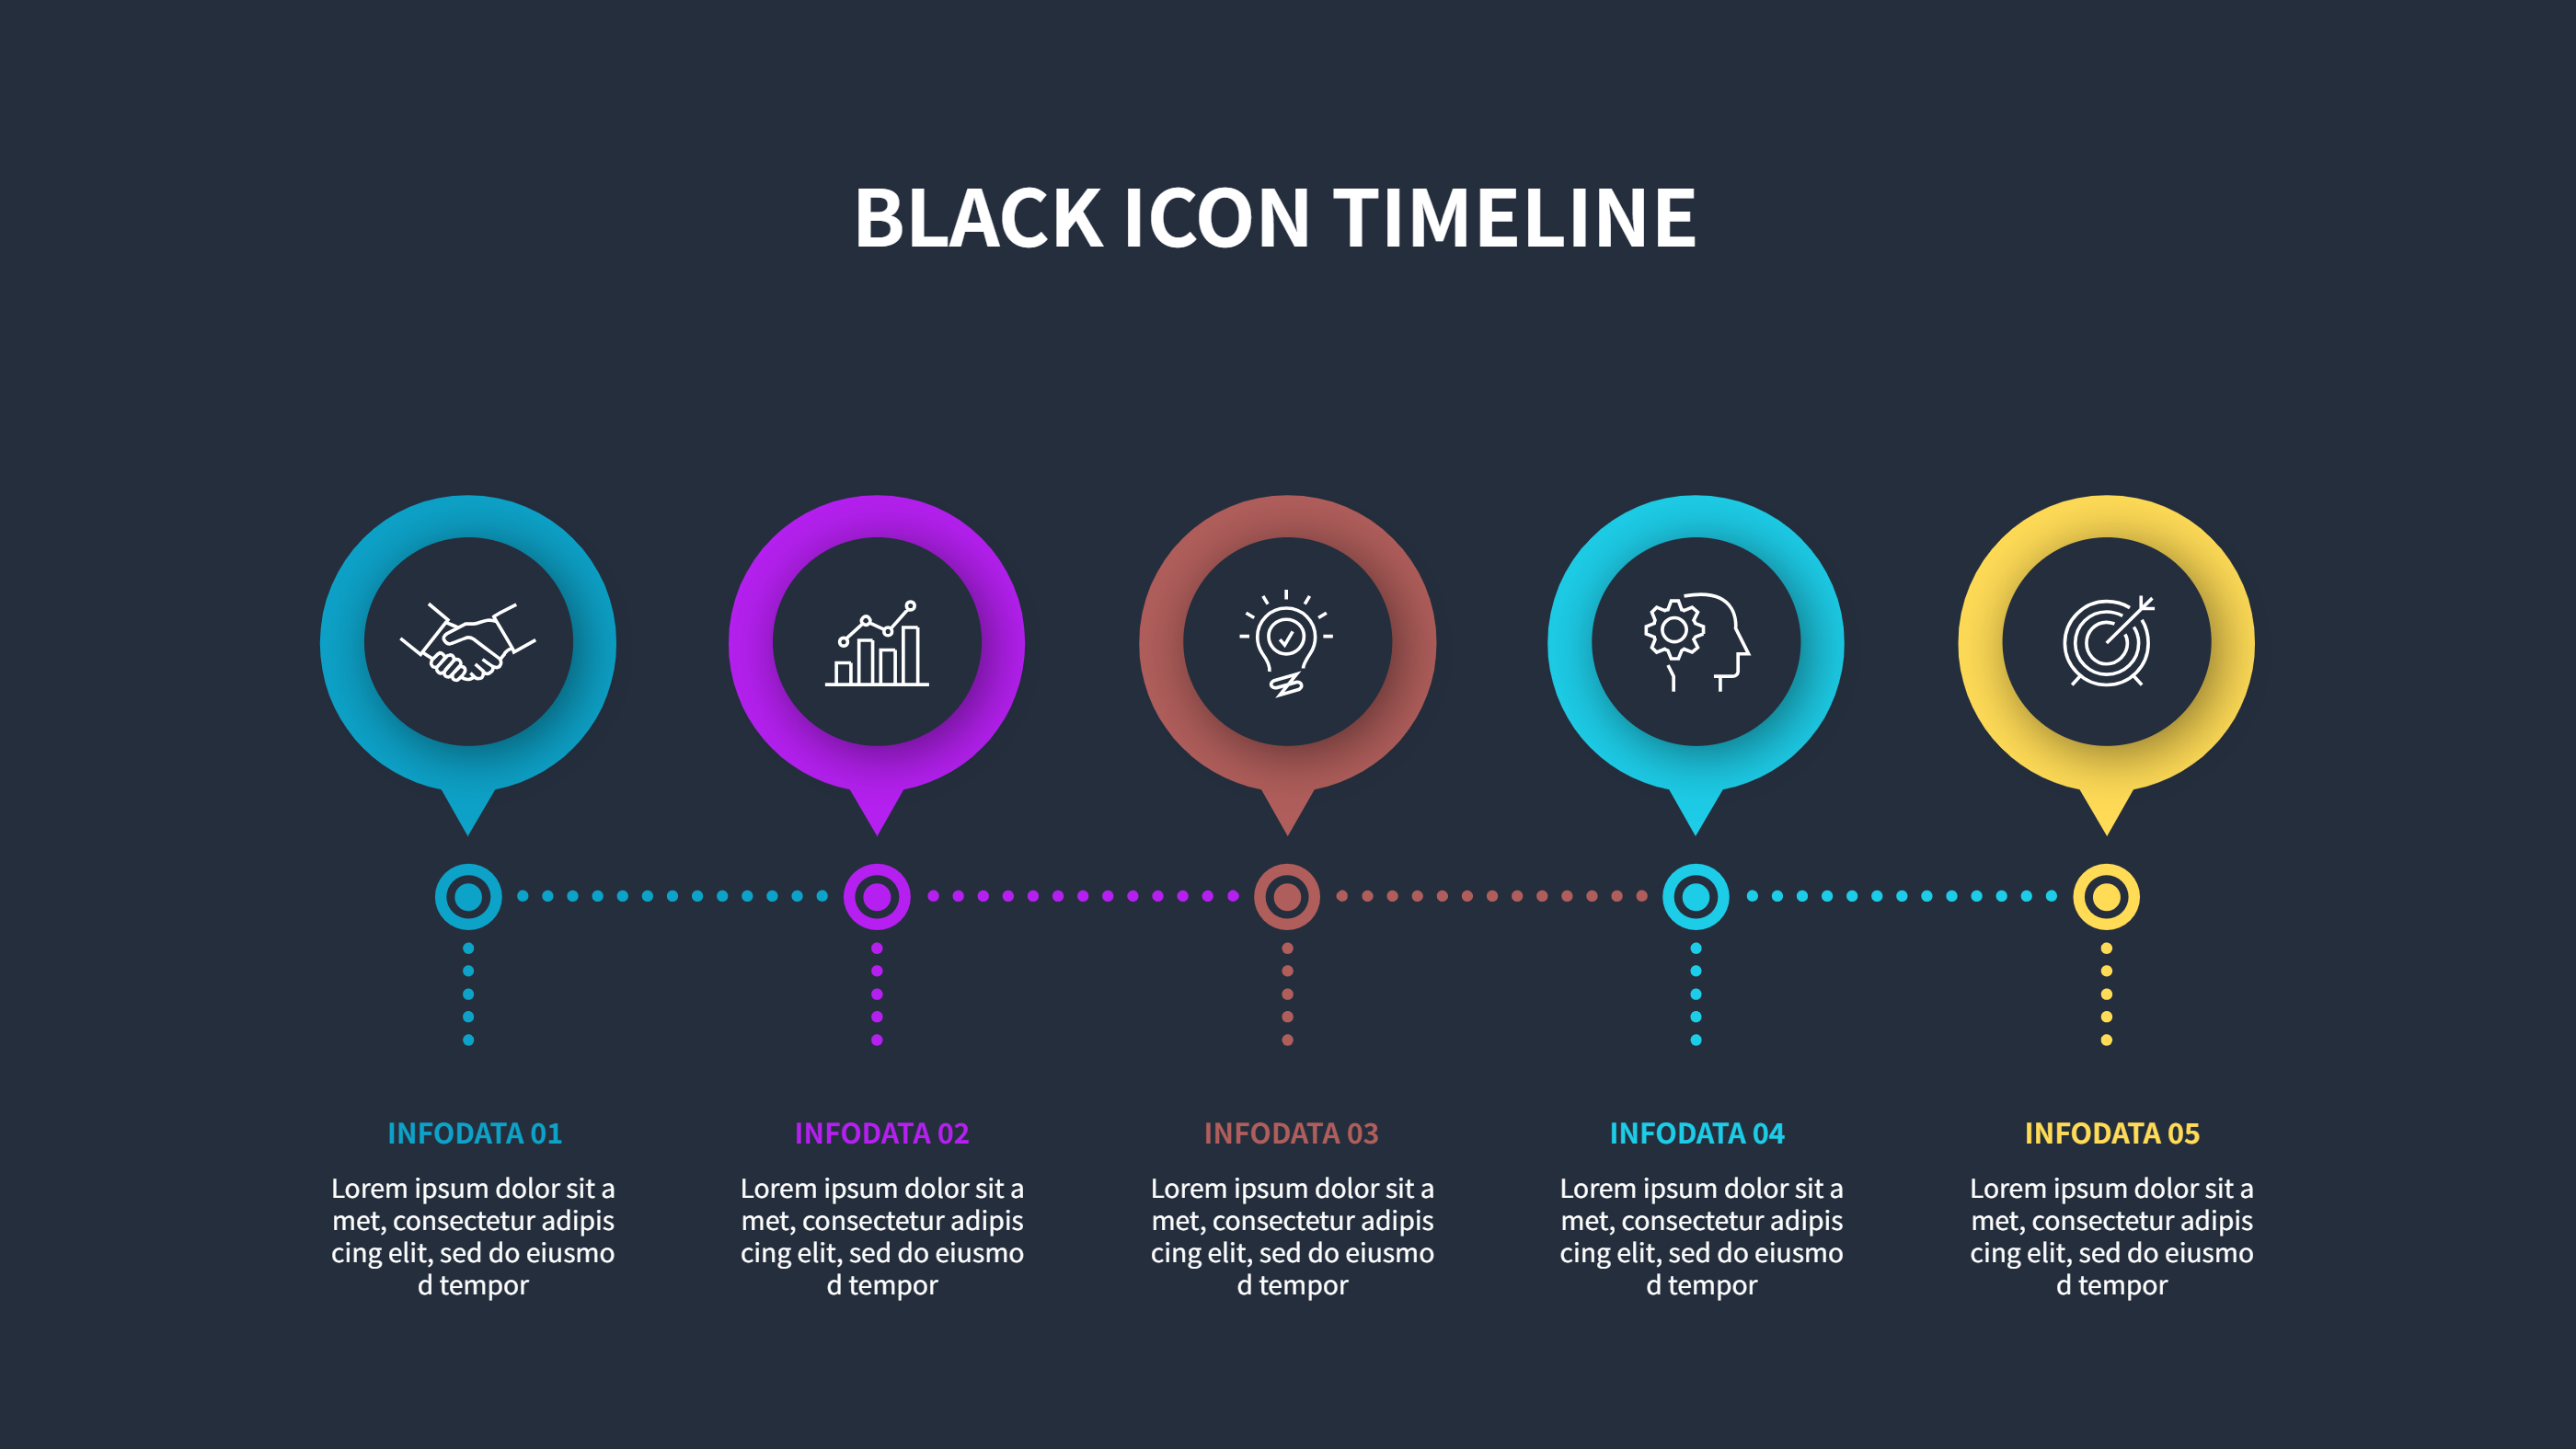
You can export the graphic for slide decks, reports, or landing pages. Add small icons only where they clarify the message. Because spacing is even, you can add or remove steps while preserving the flow. The design prints cleanly for handouts and stays readable on mobile. Duplicate it for separate workstreams while keeping the same visual style.
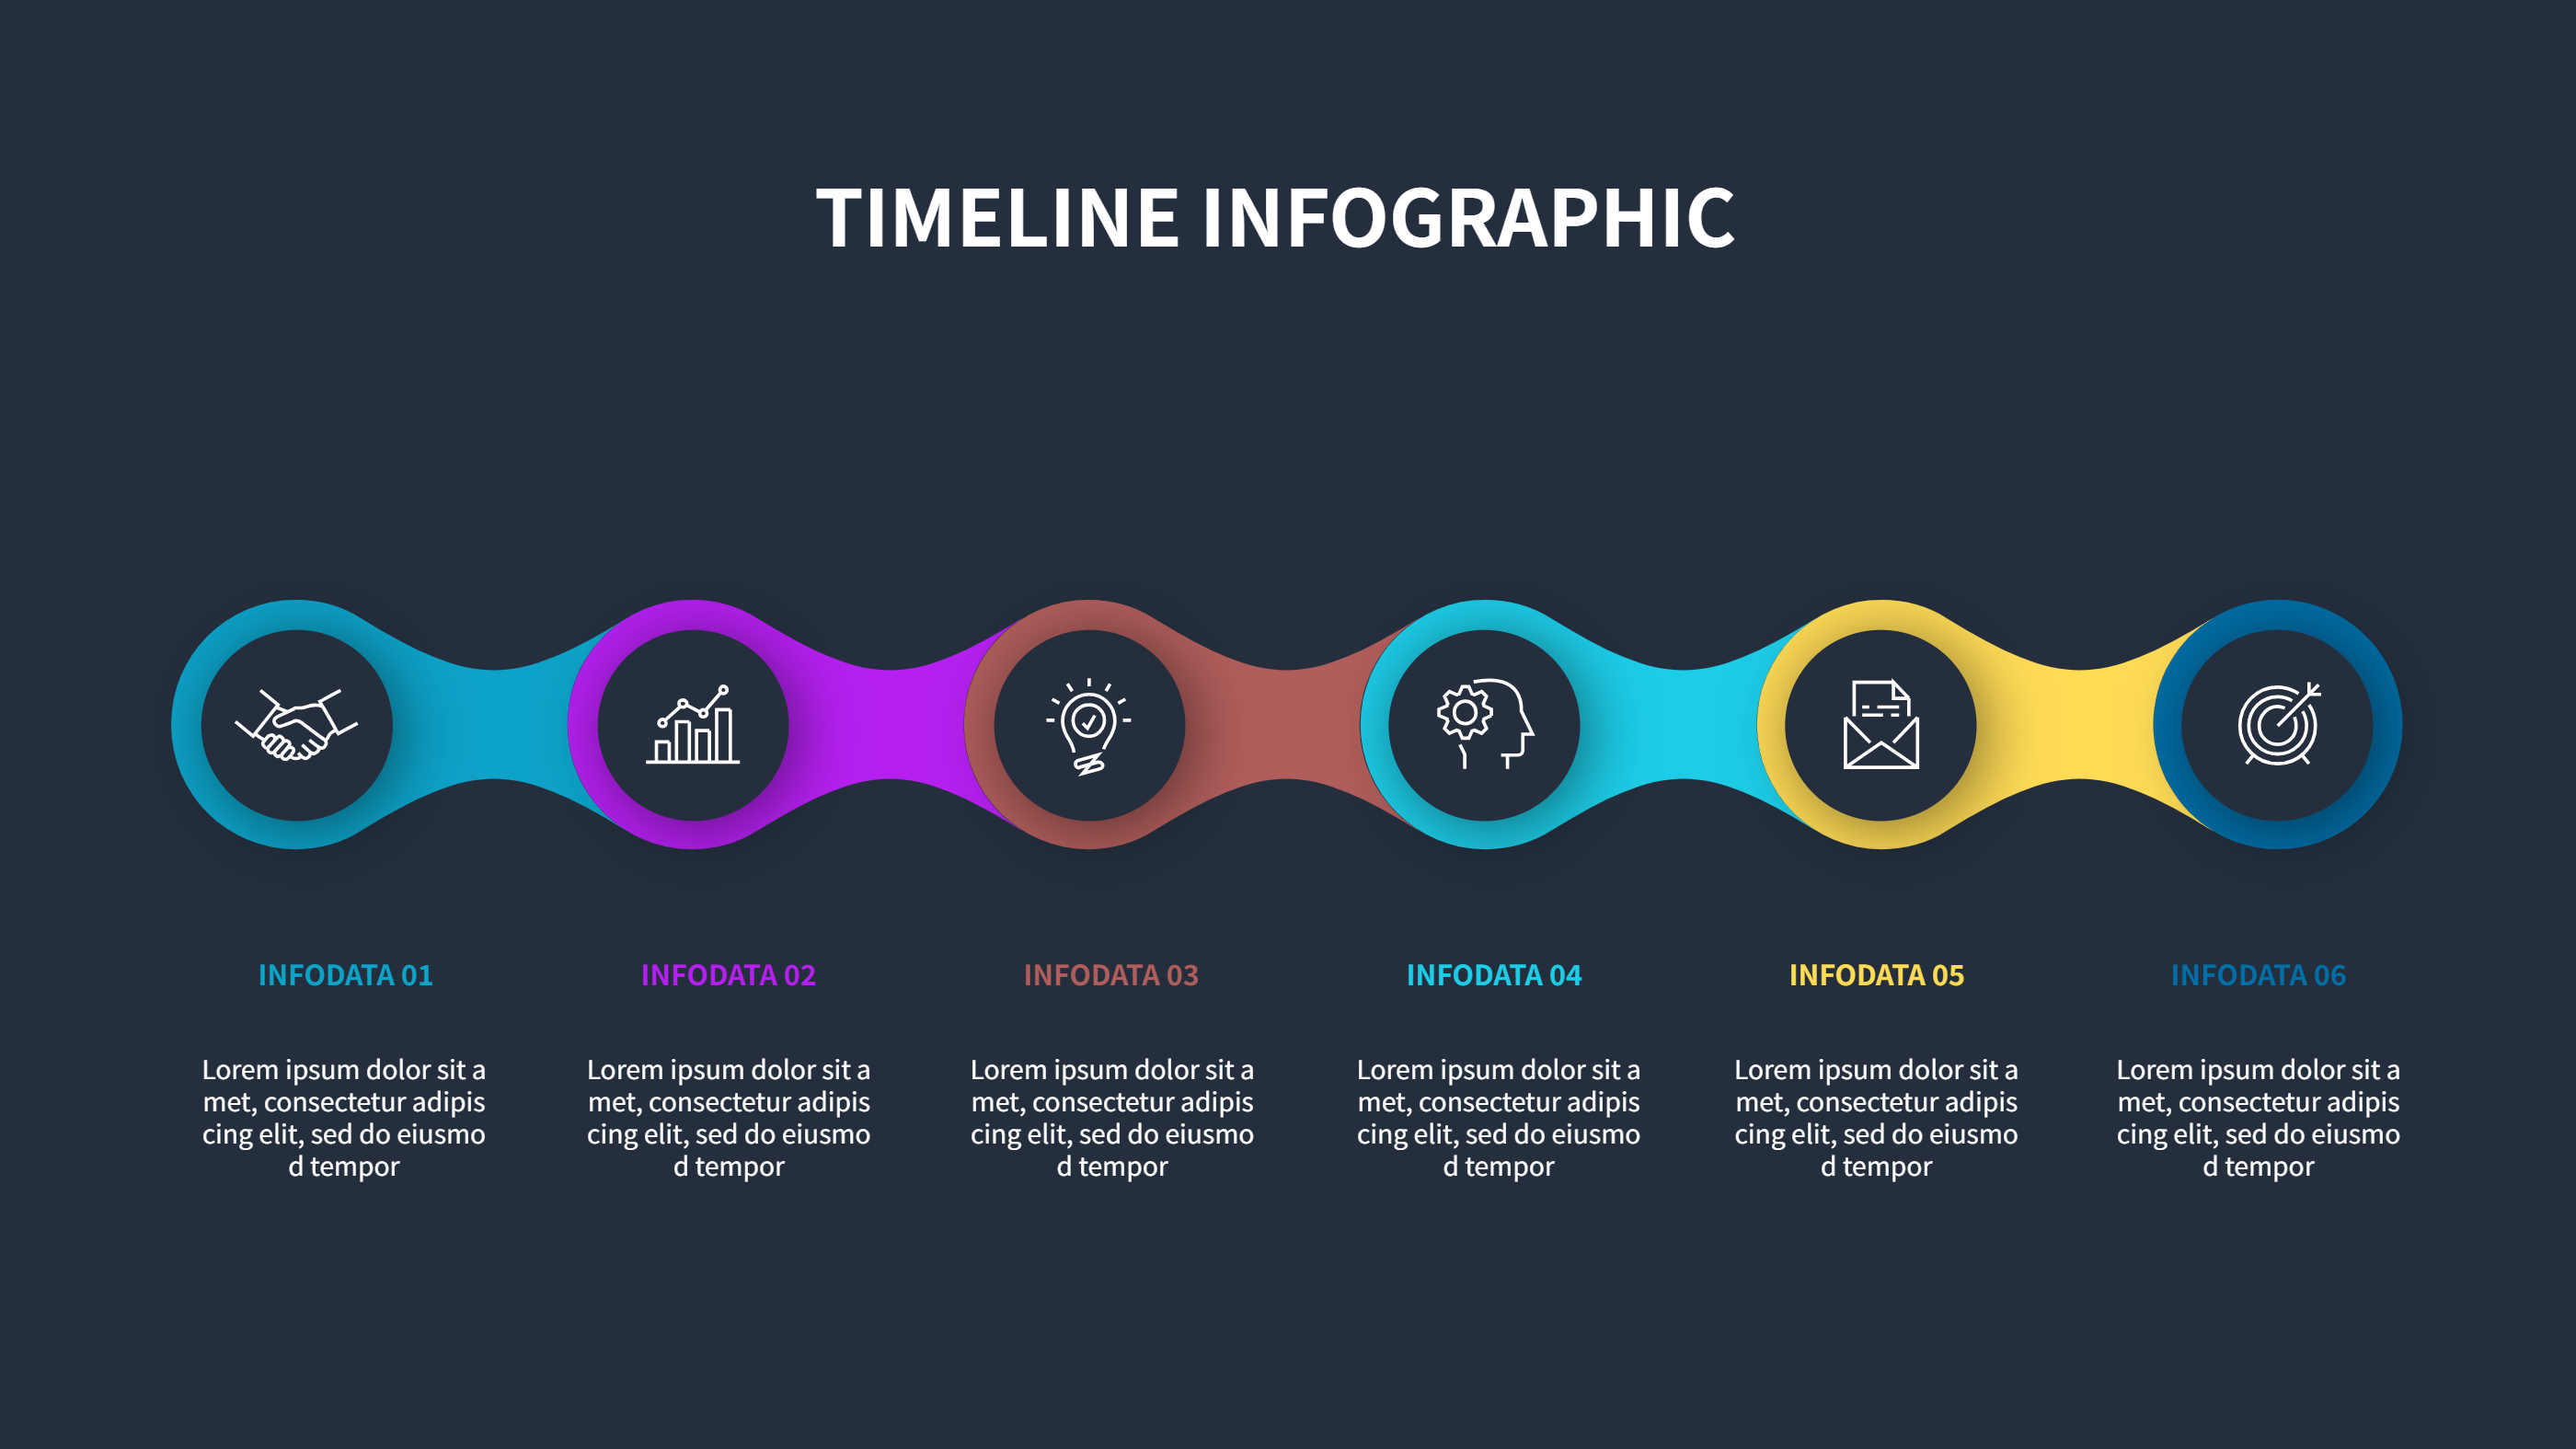
Open the AI creation tool on the homepage, select this template, and enter your prompt to generate the infographic. This stepped timeline keeps sequences clear, saves design effort, and helps teams see the story at a glance.