Medical Case Report Timeline Graphic Template
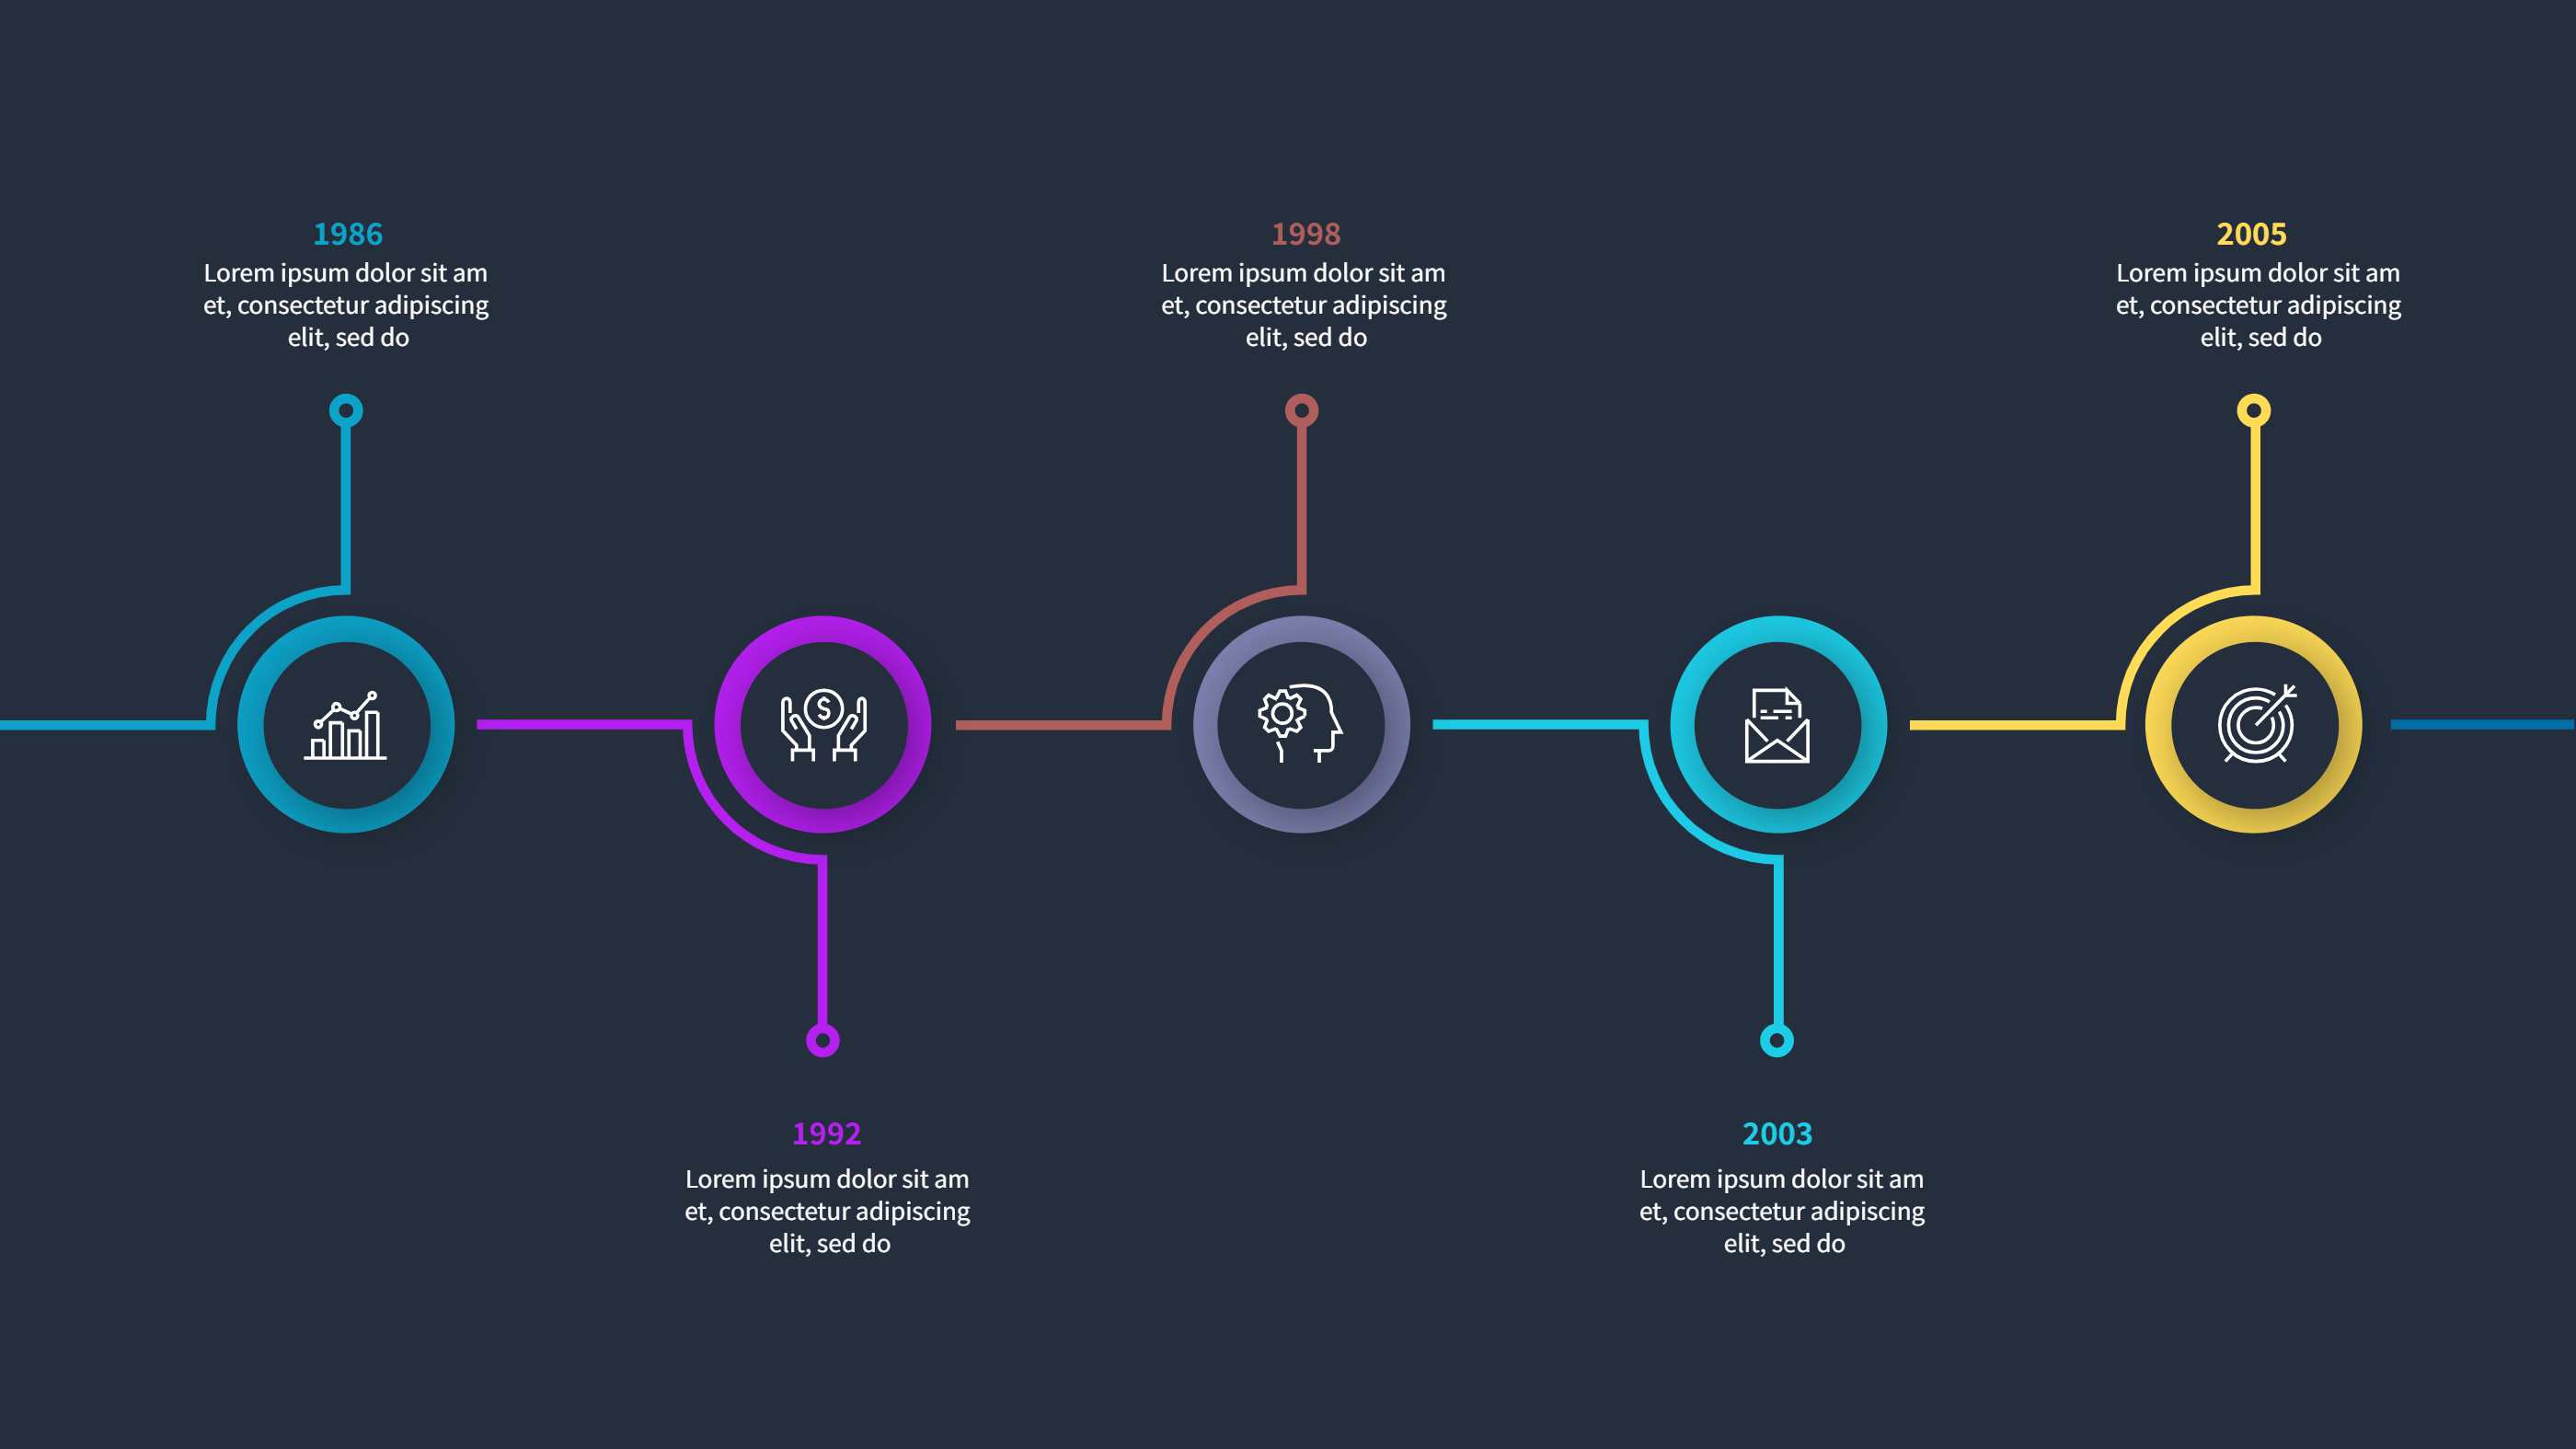
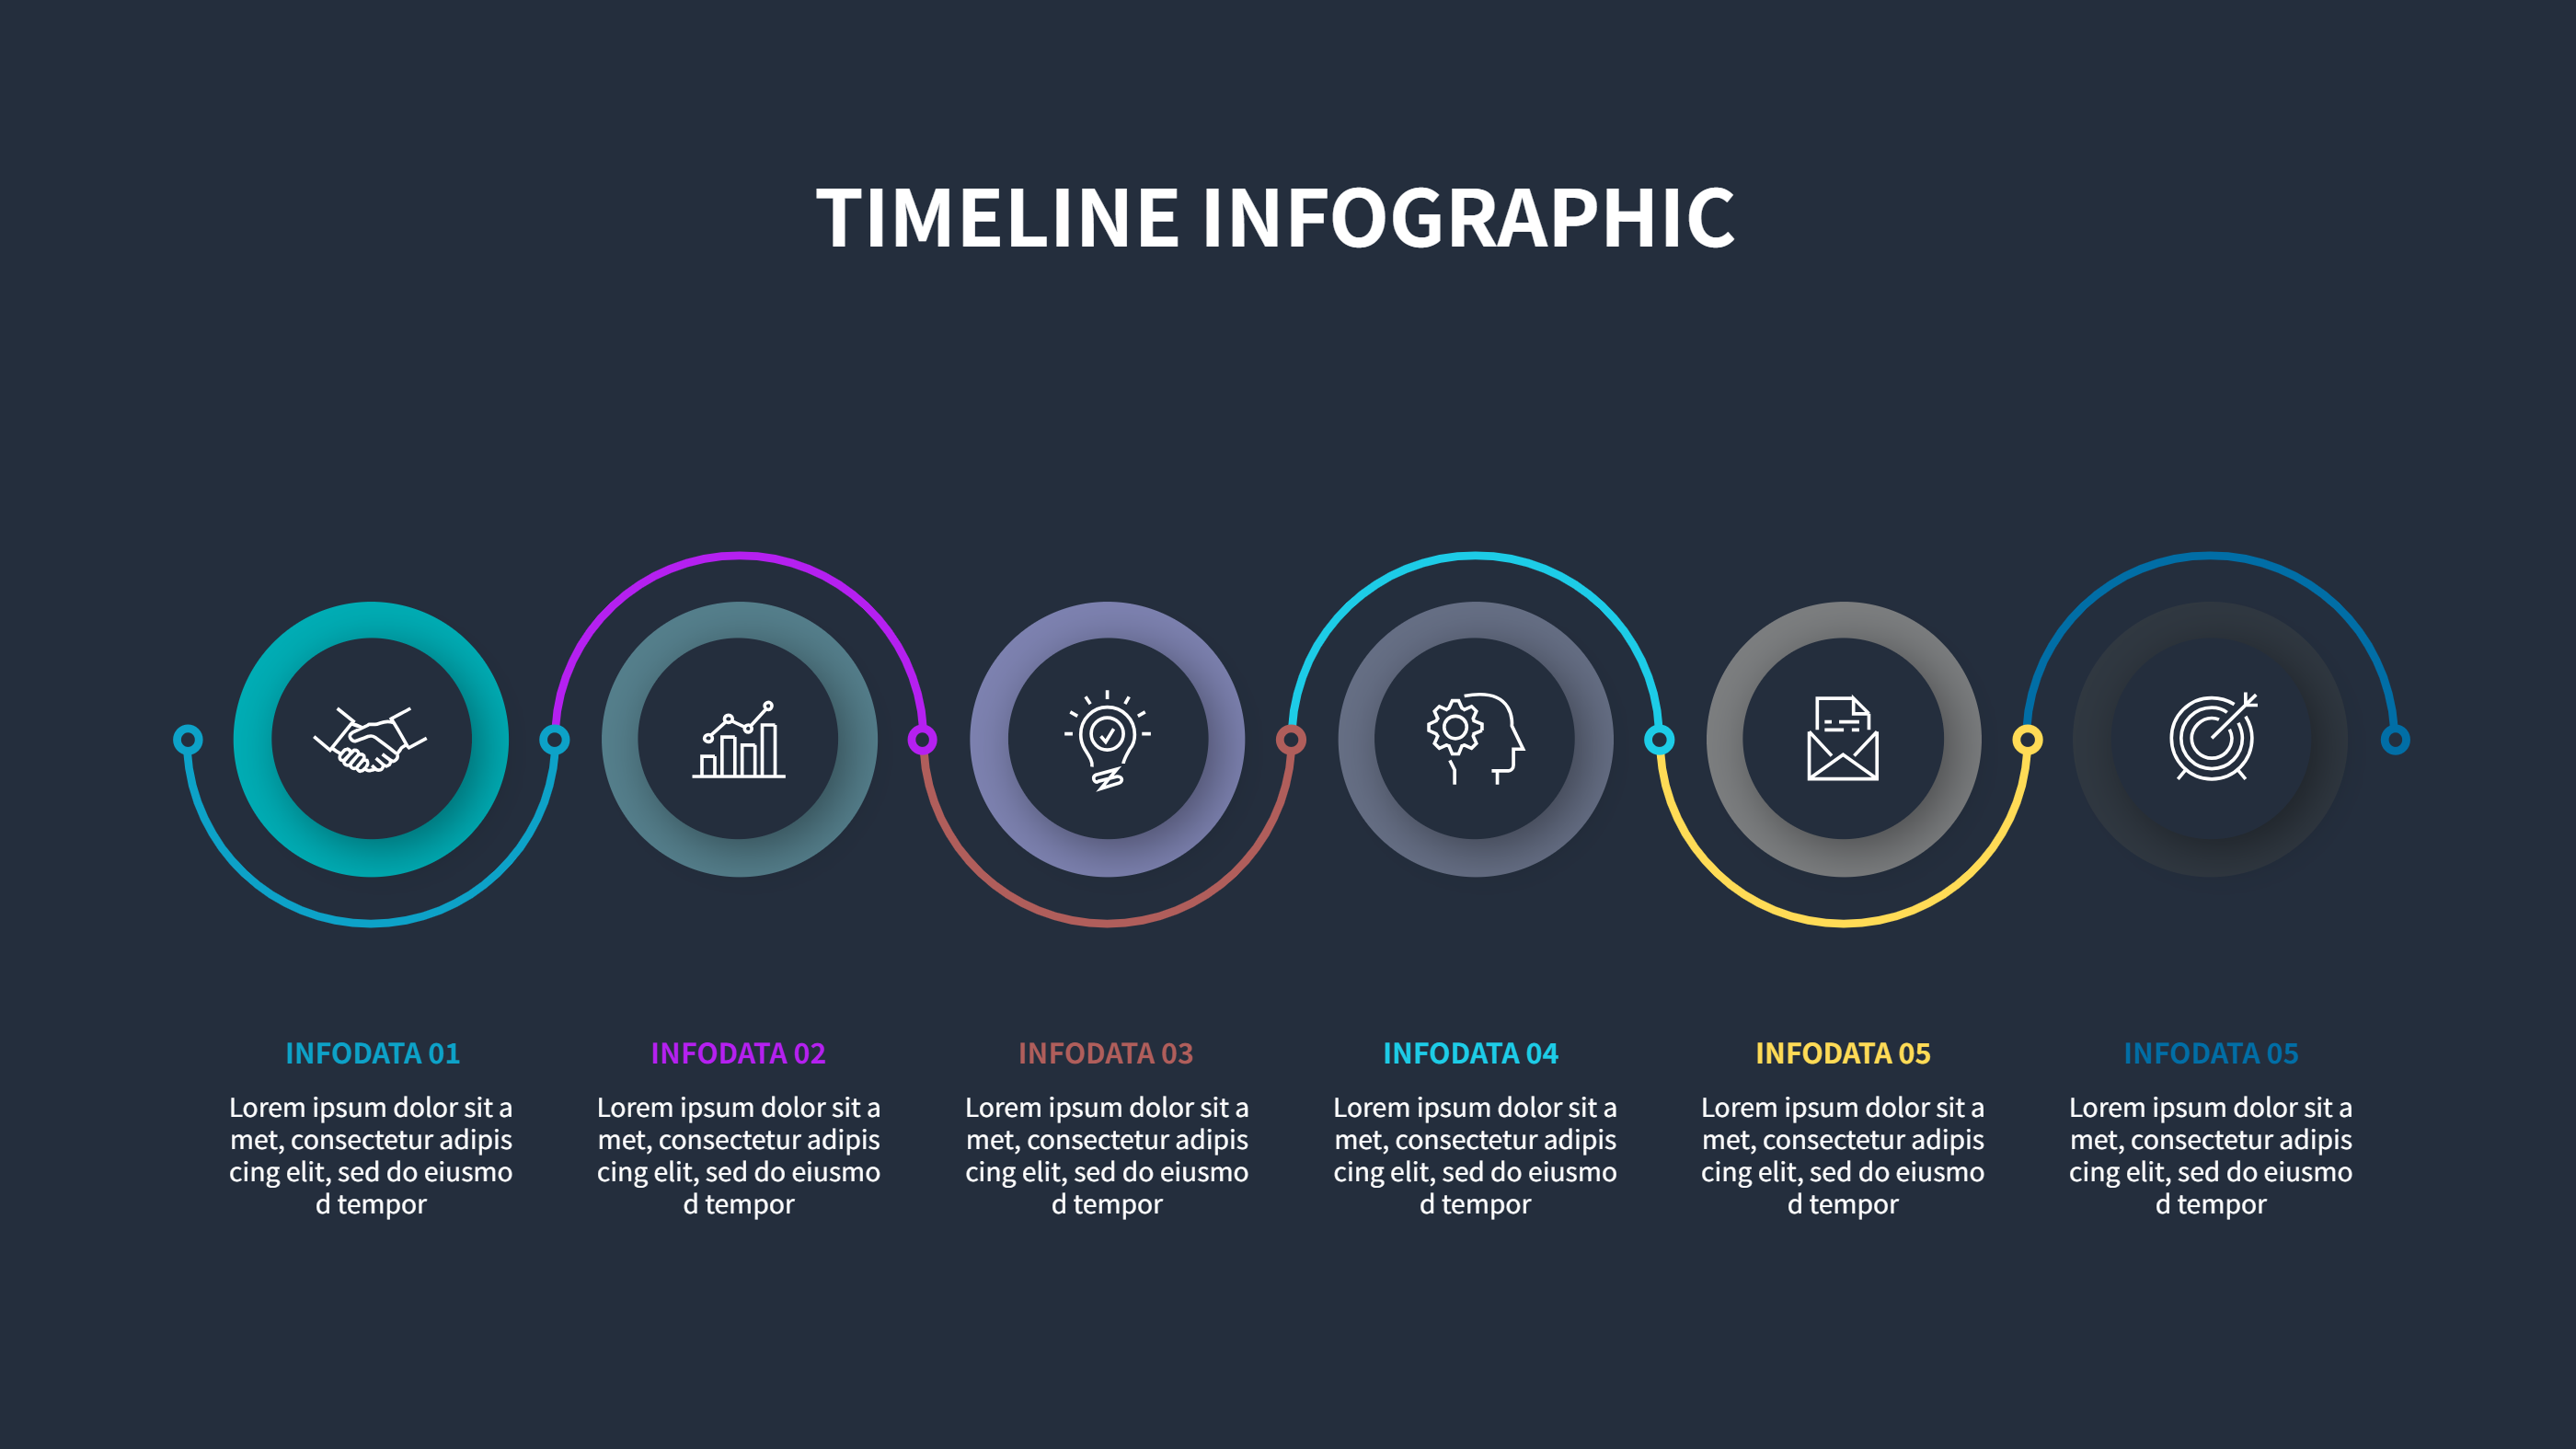
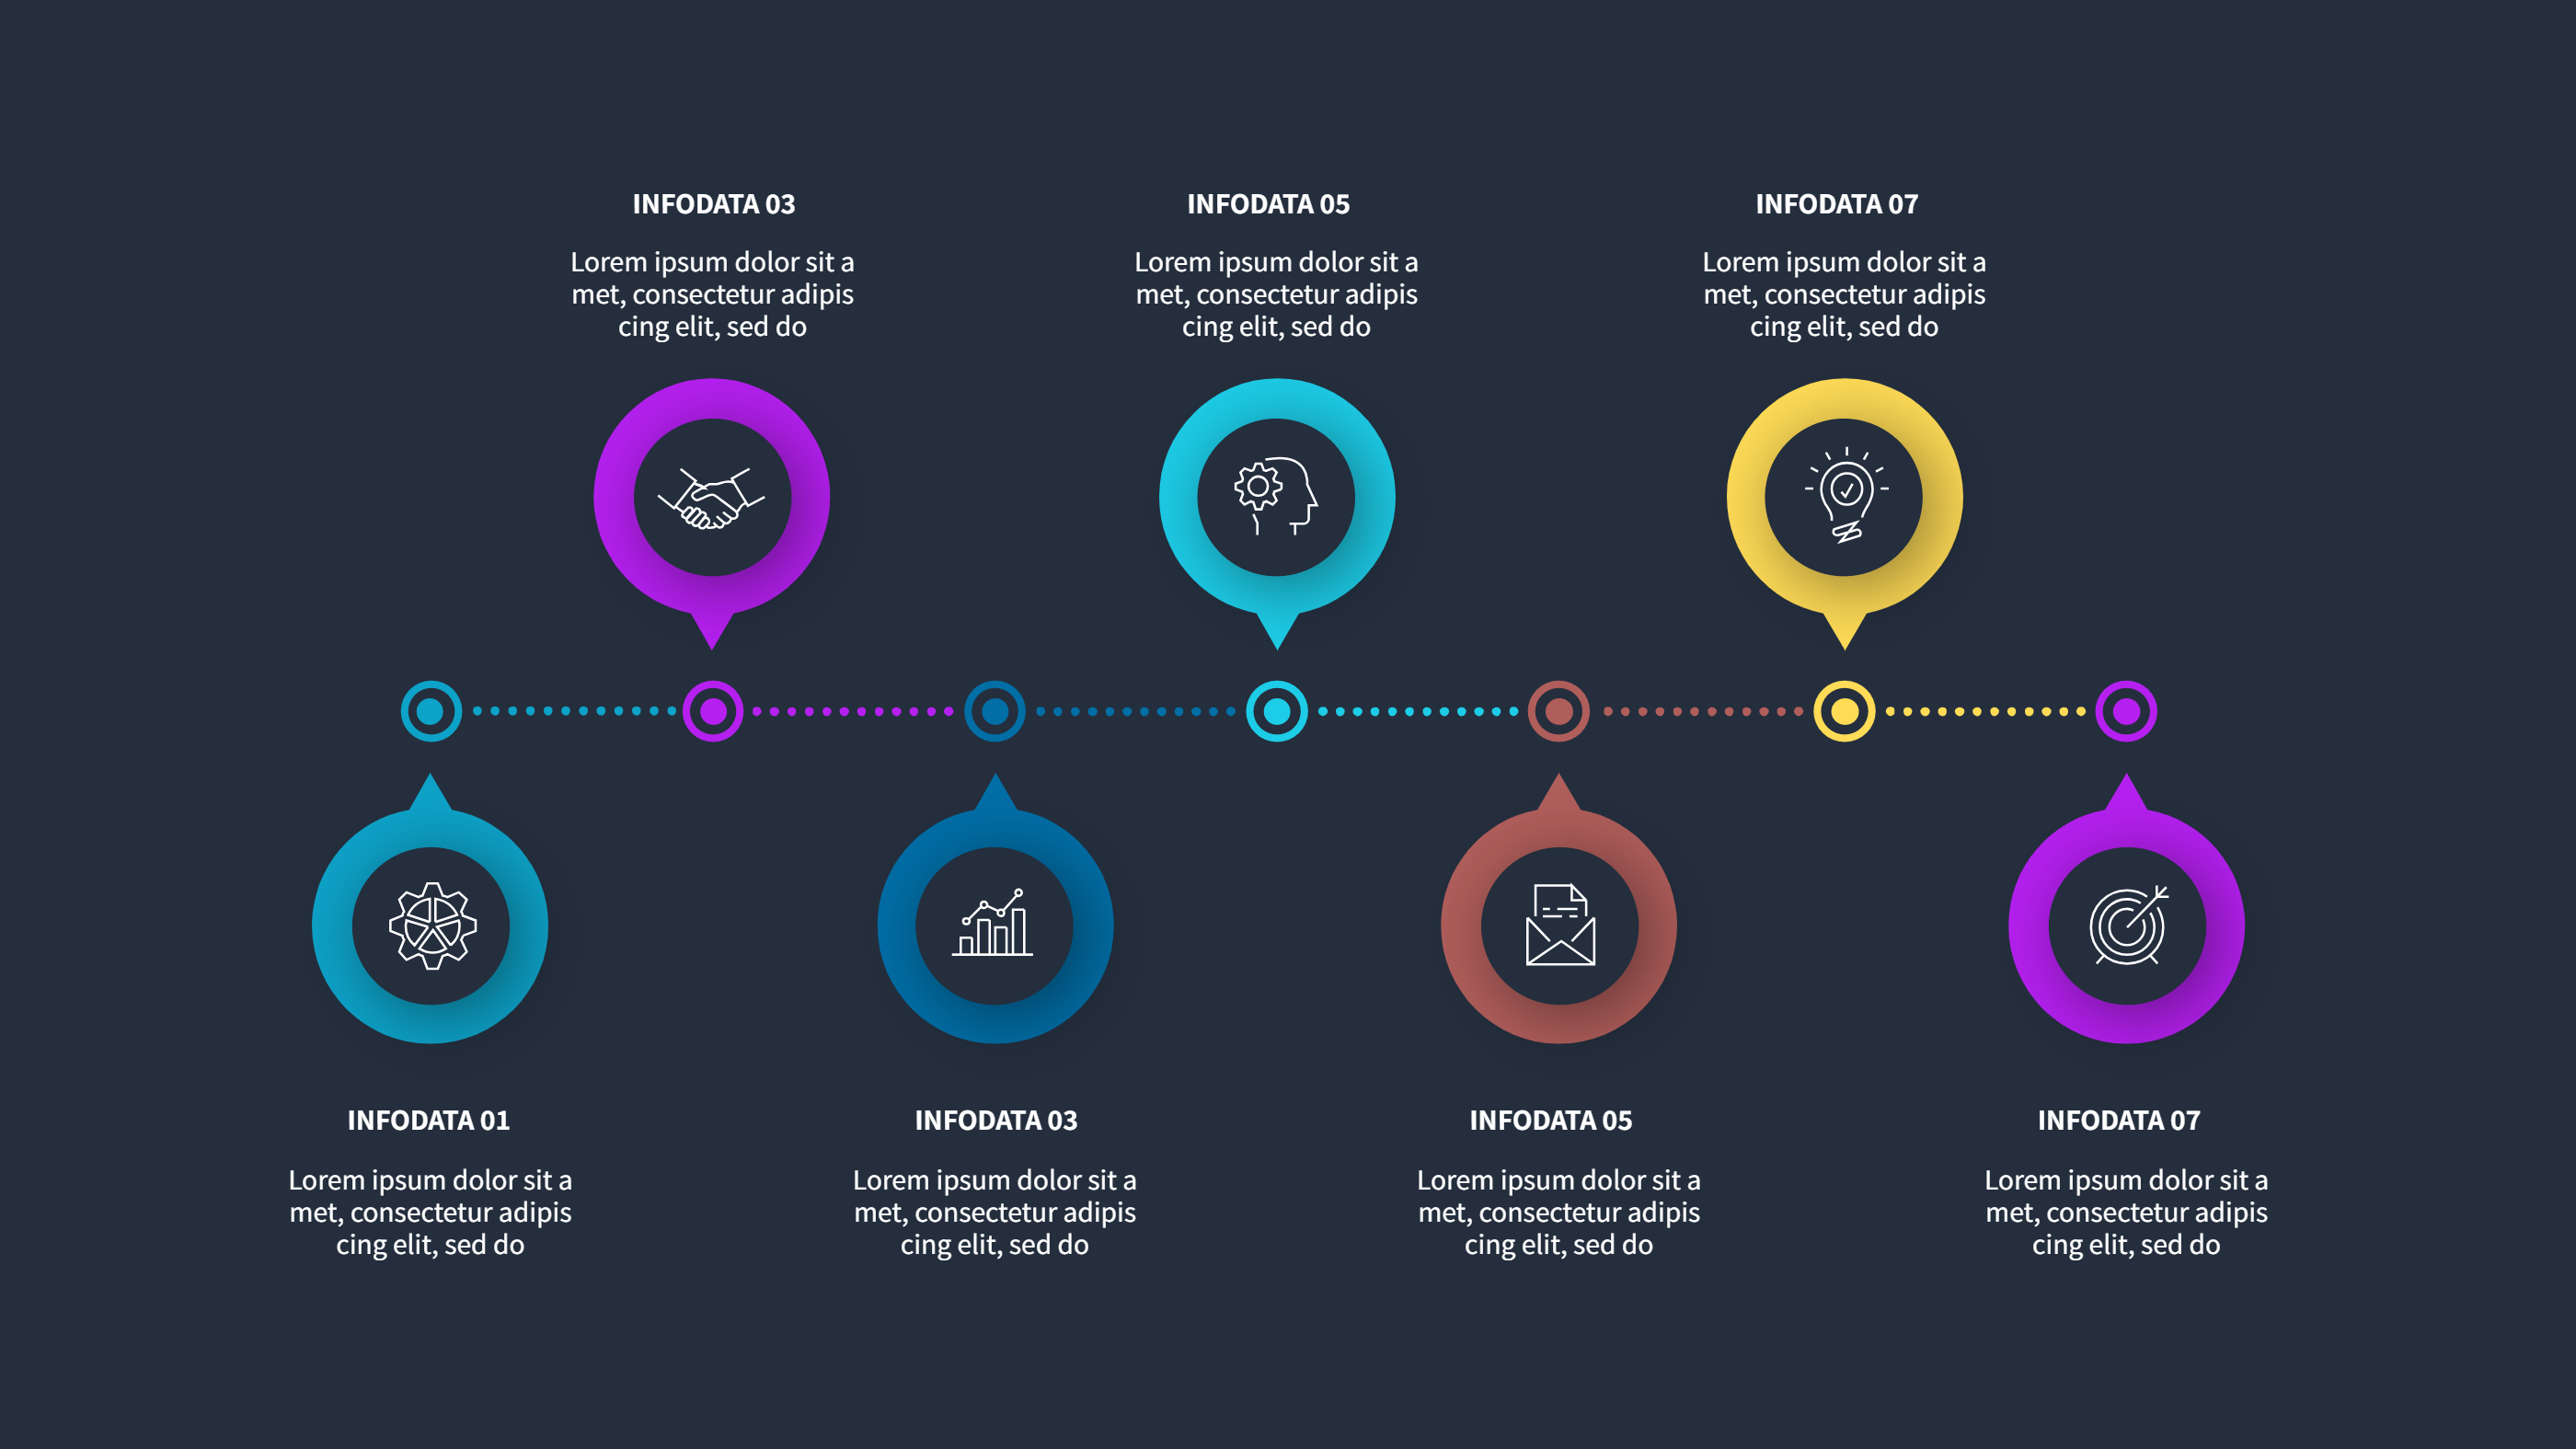
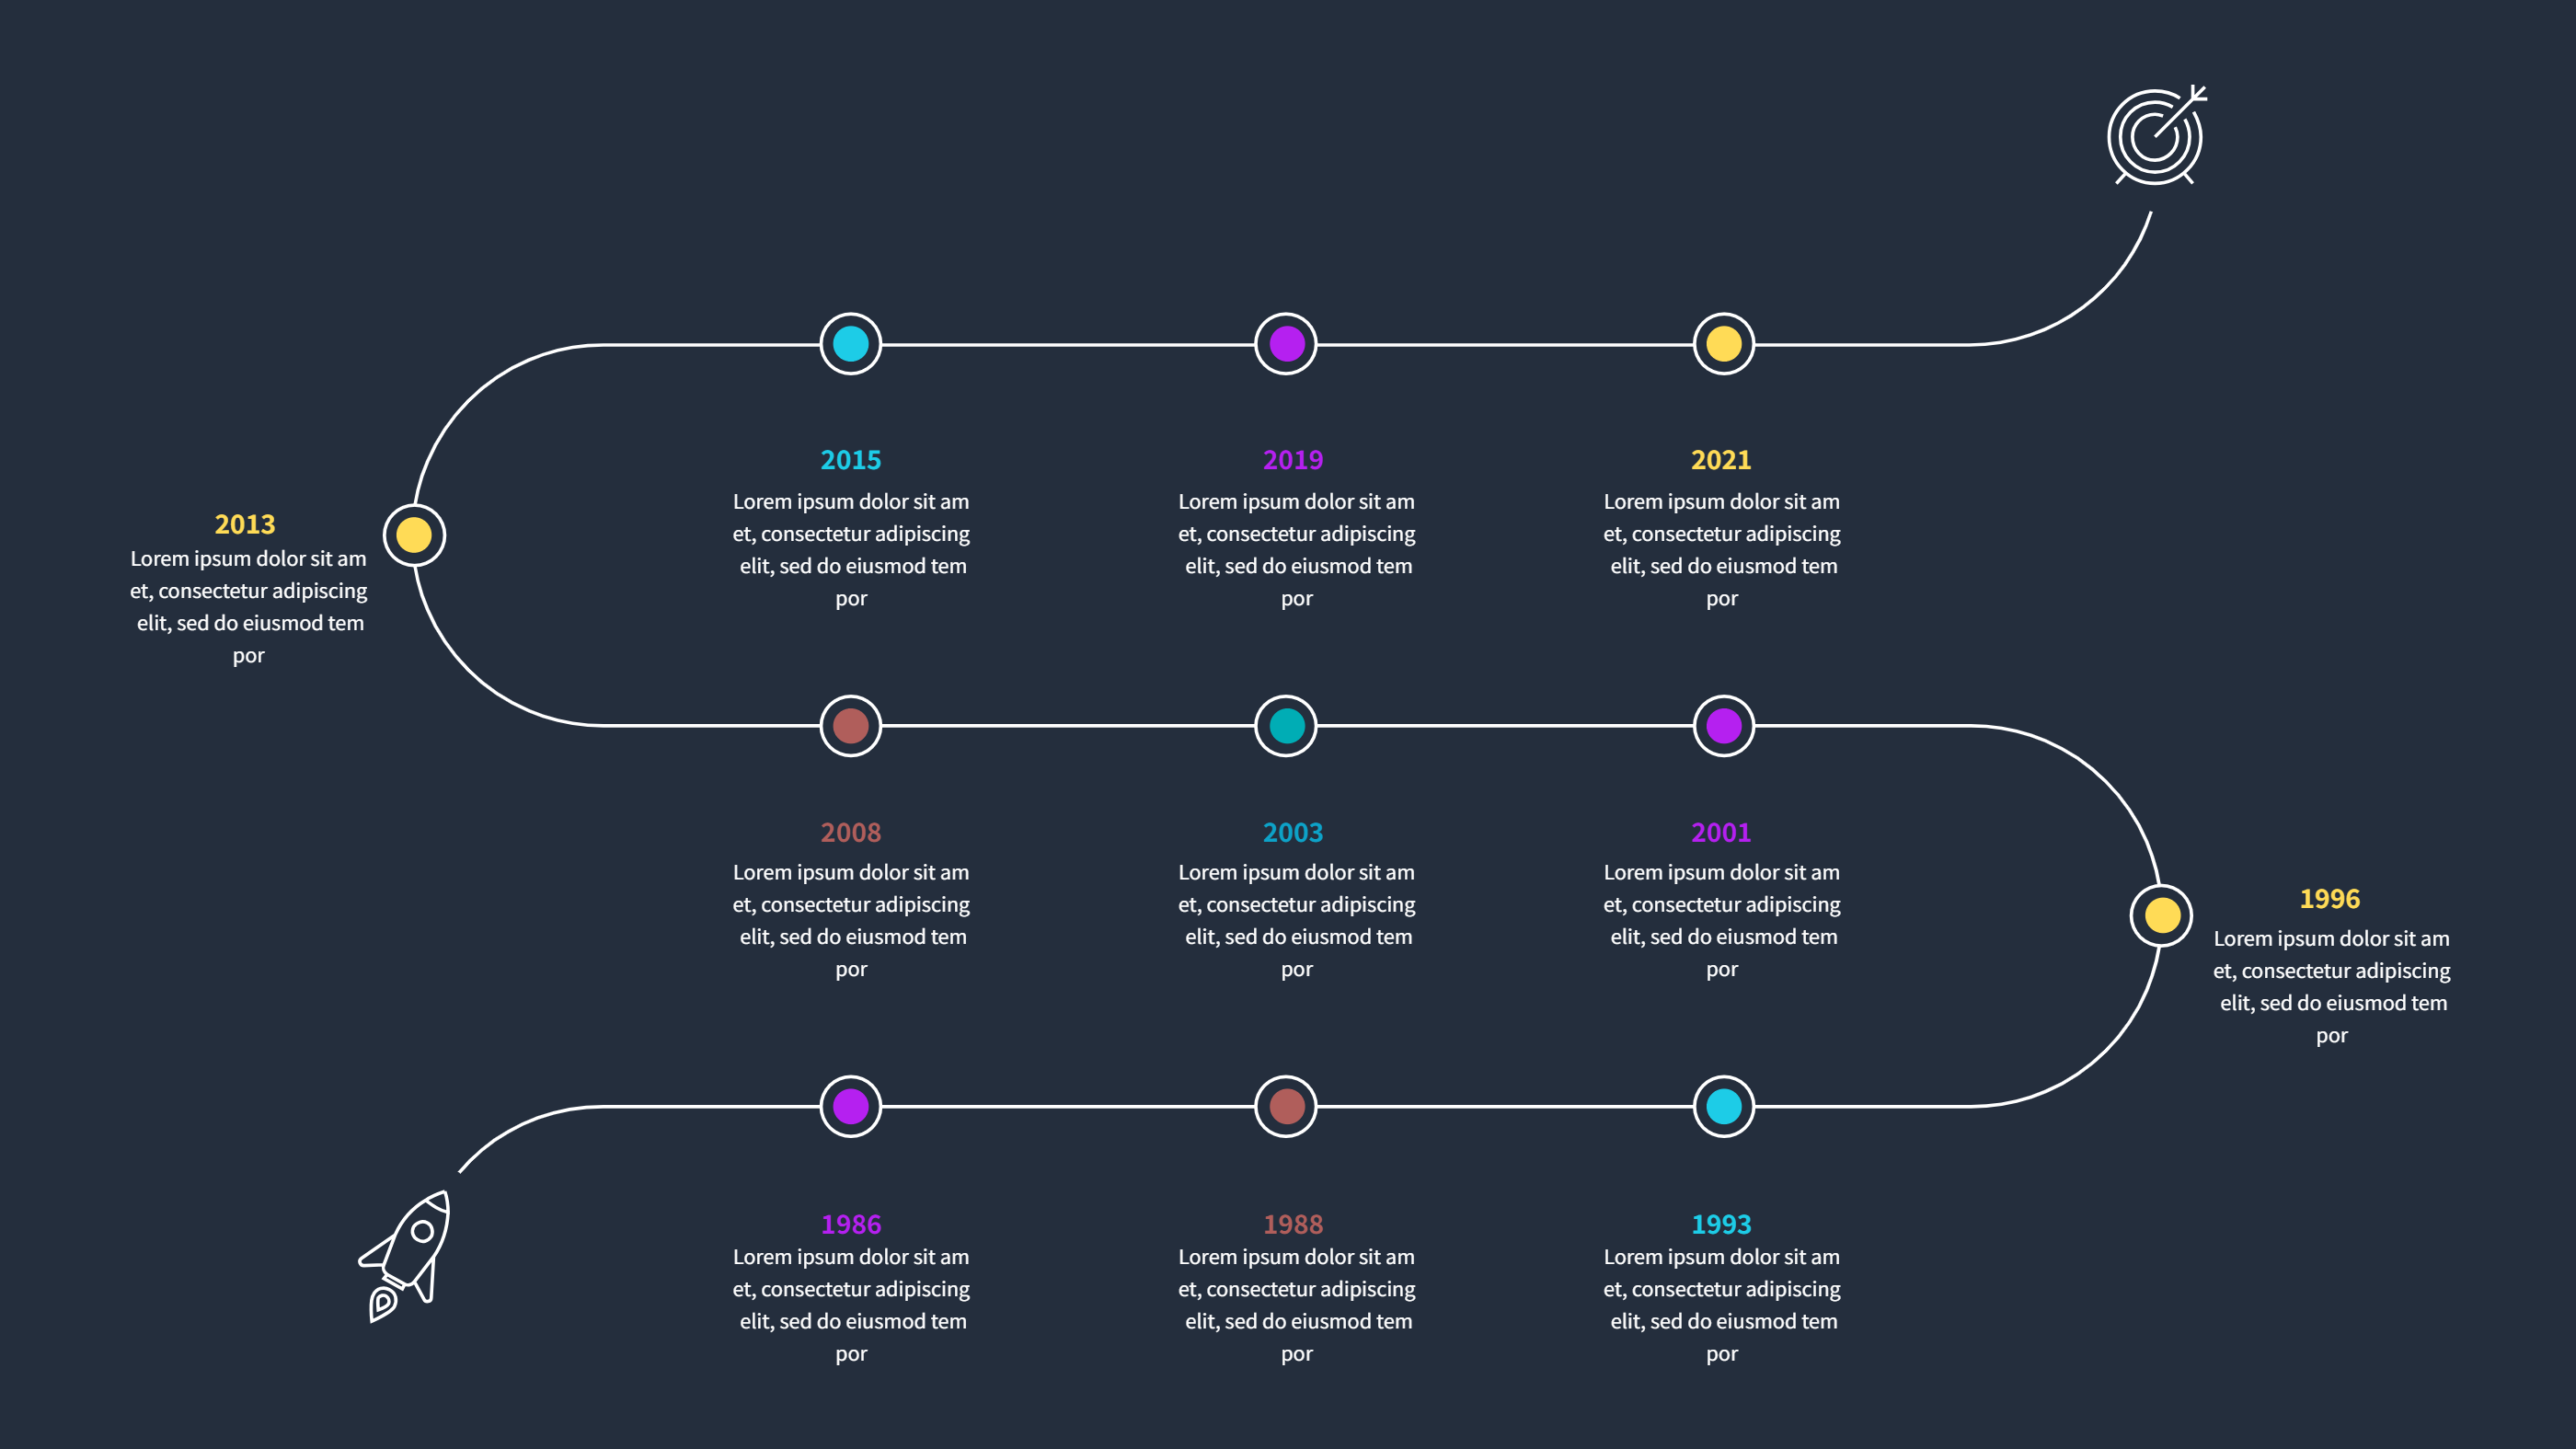
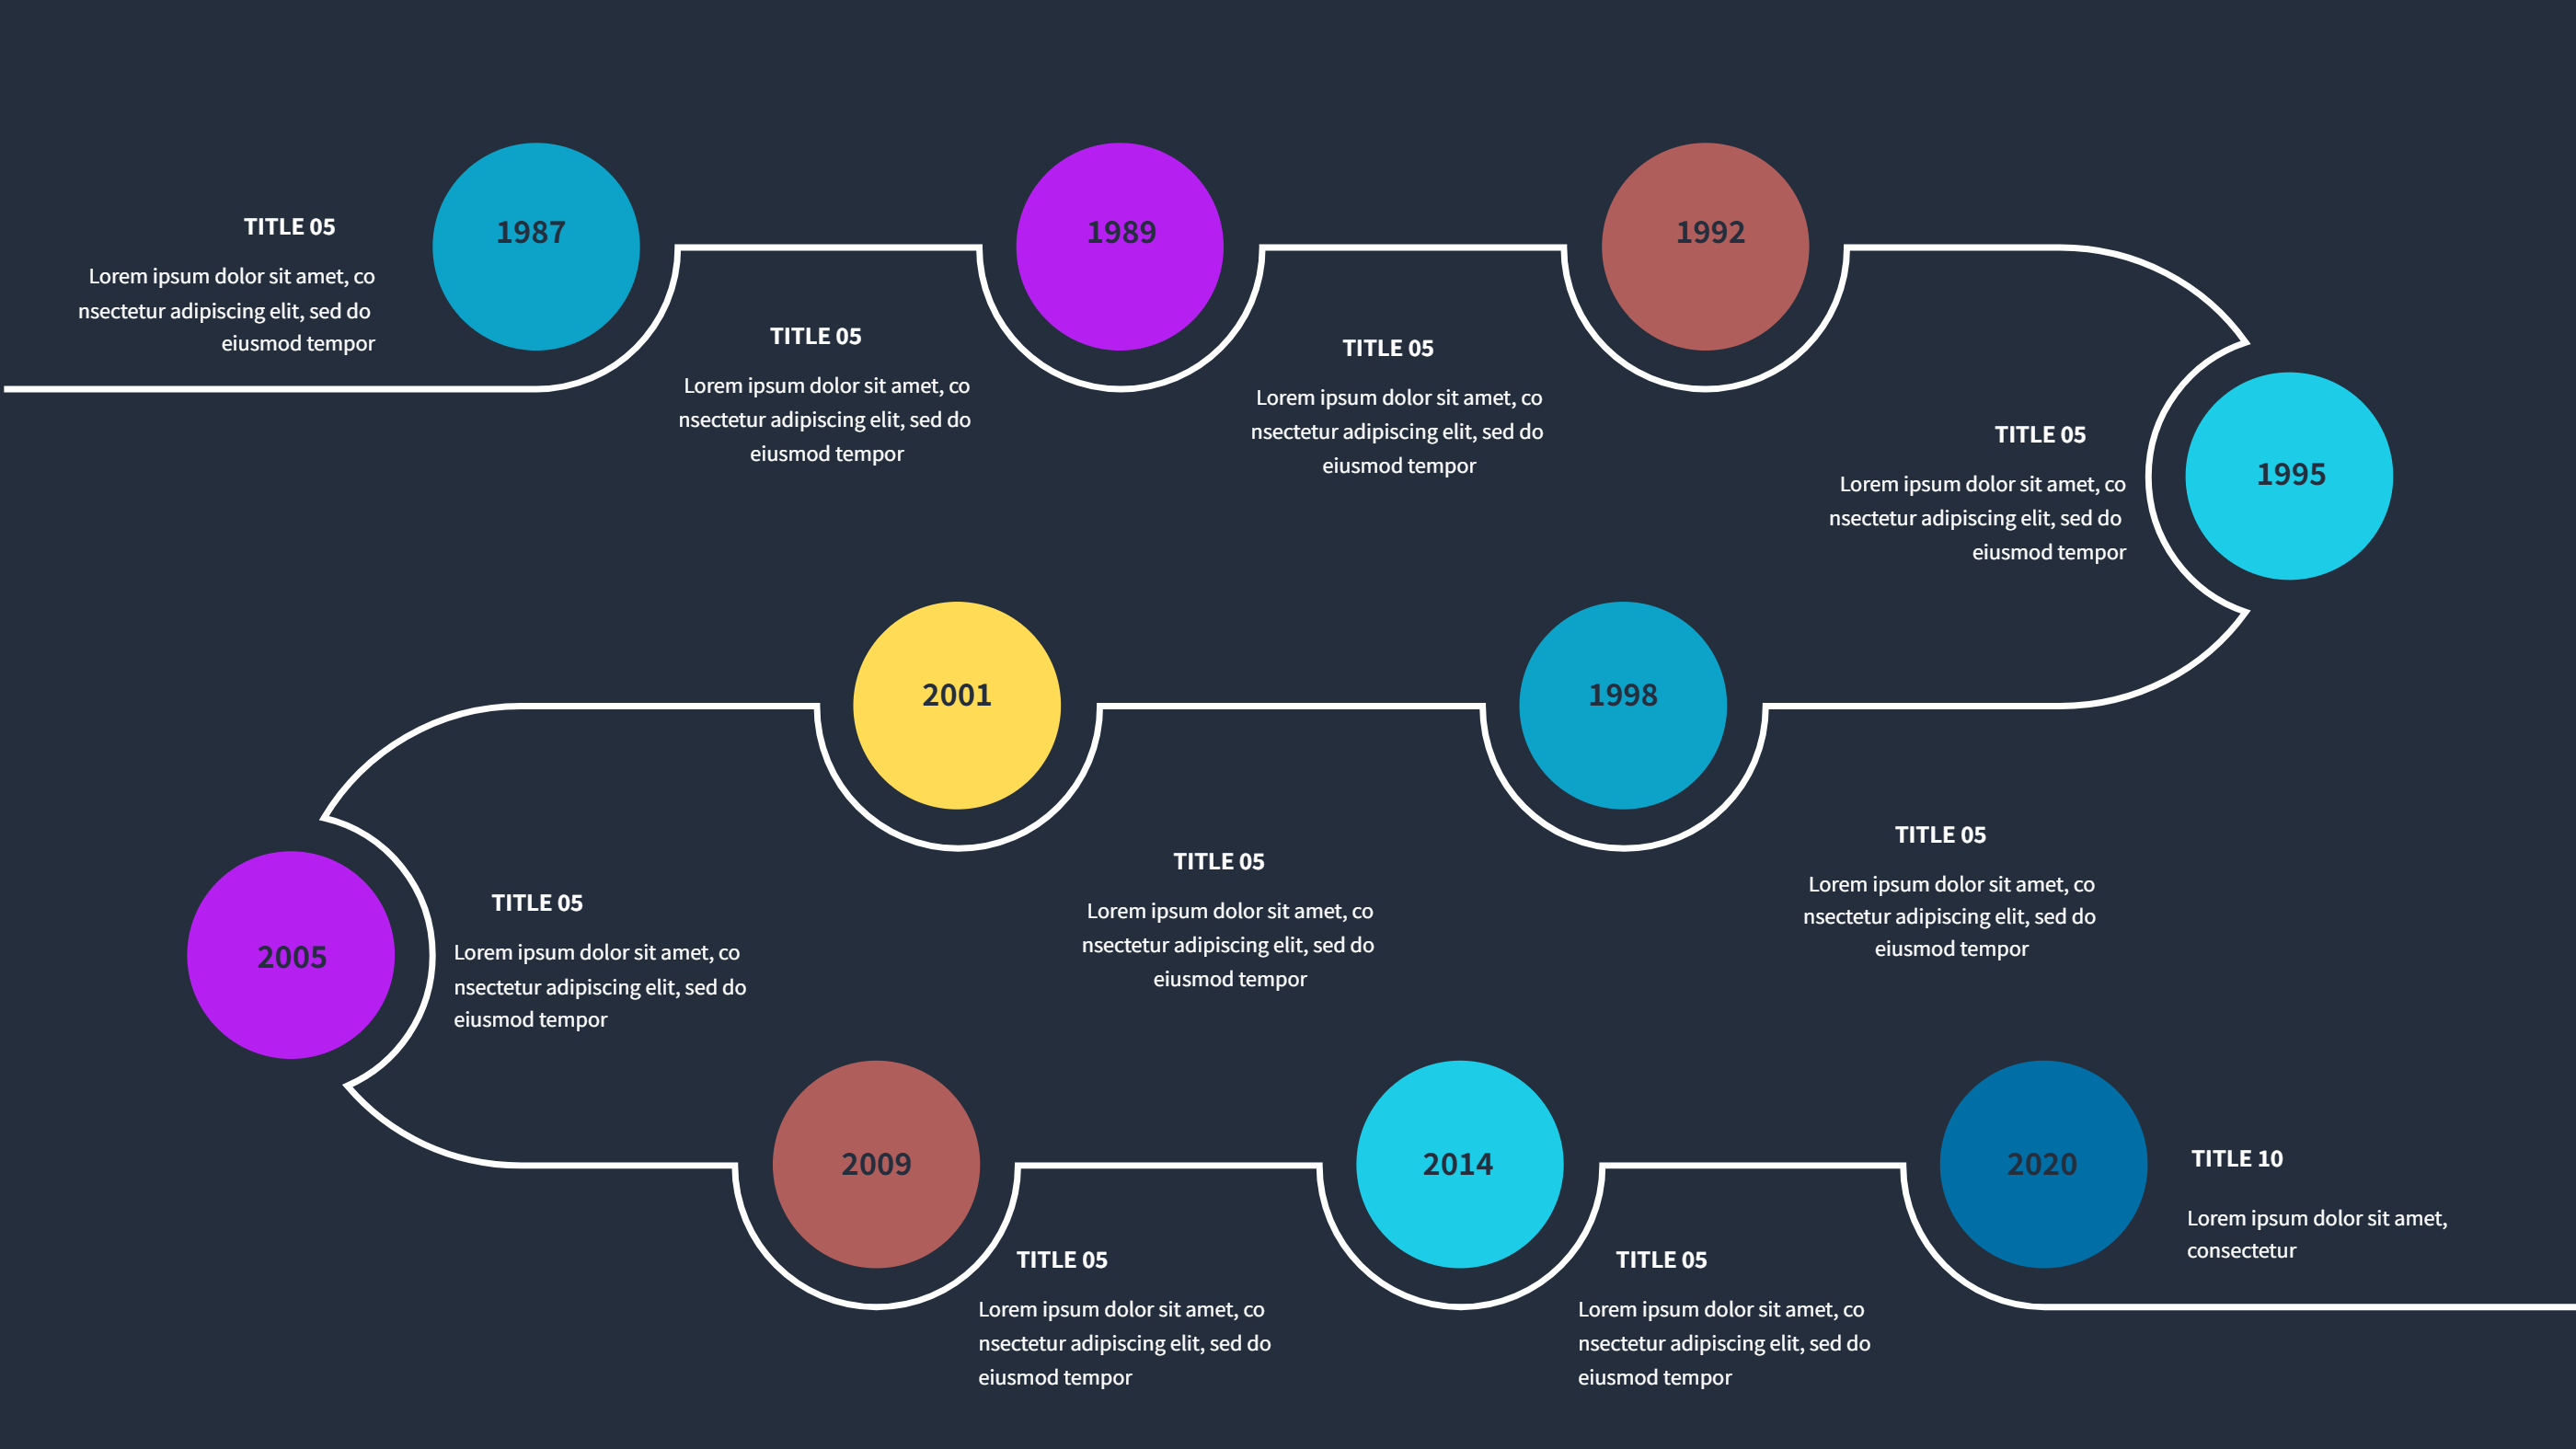
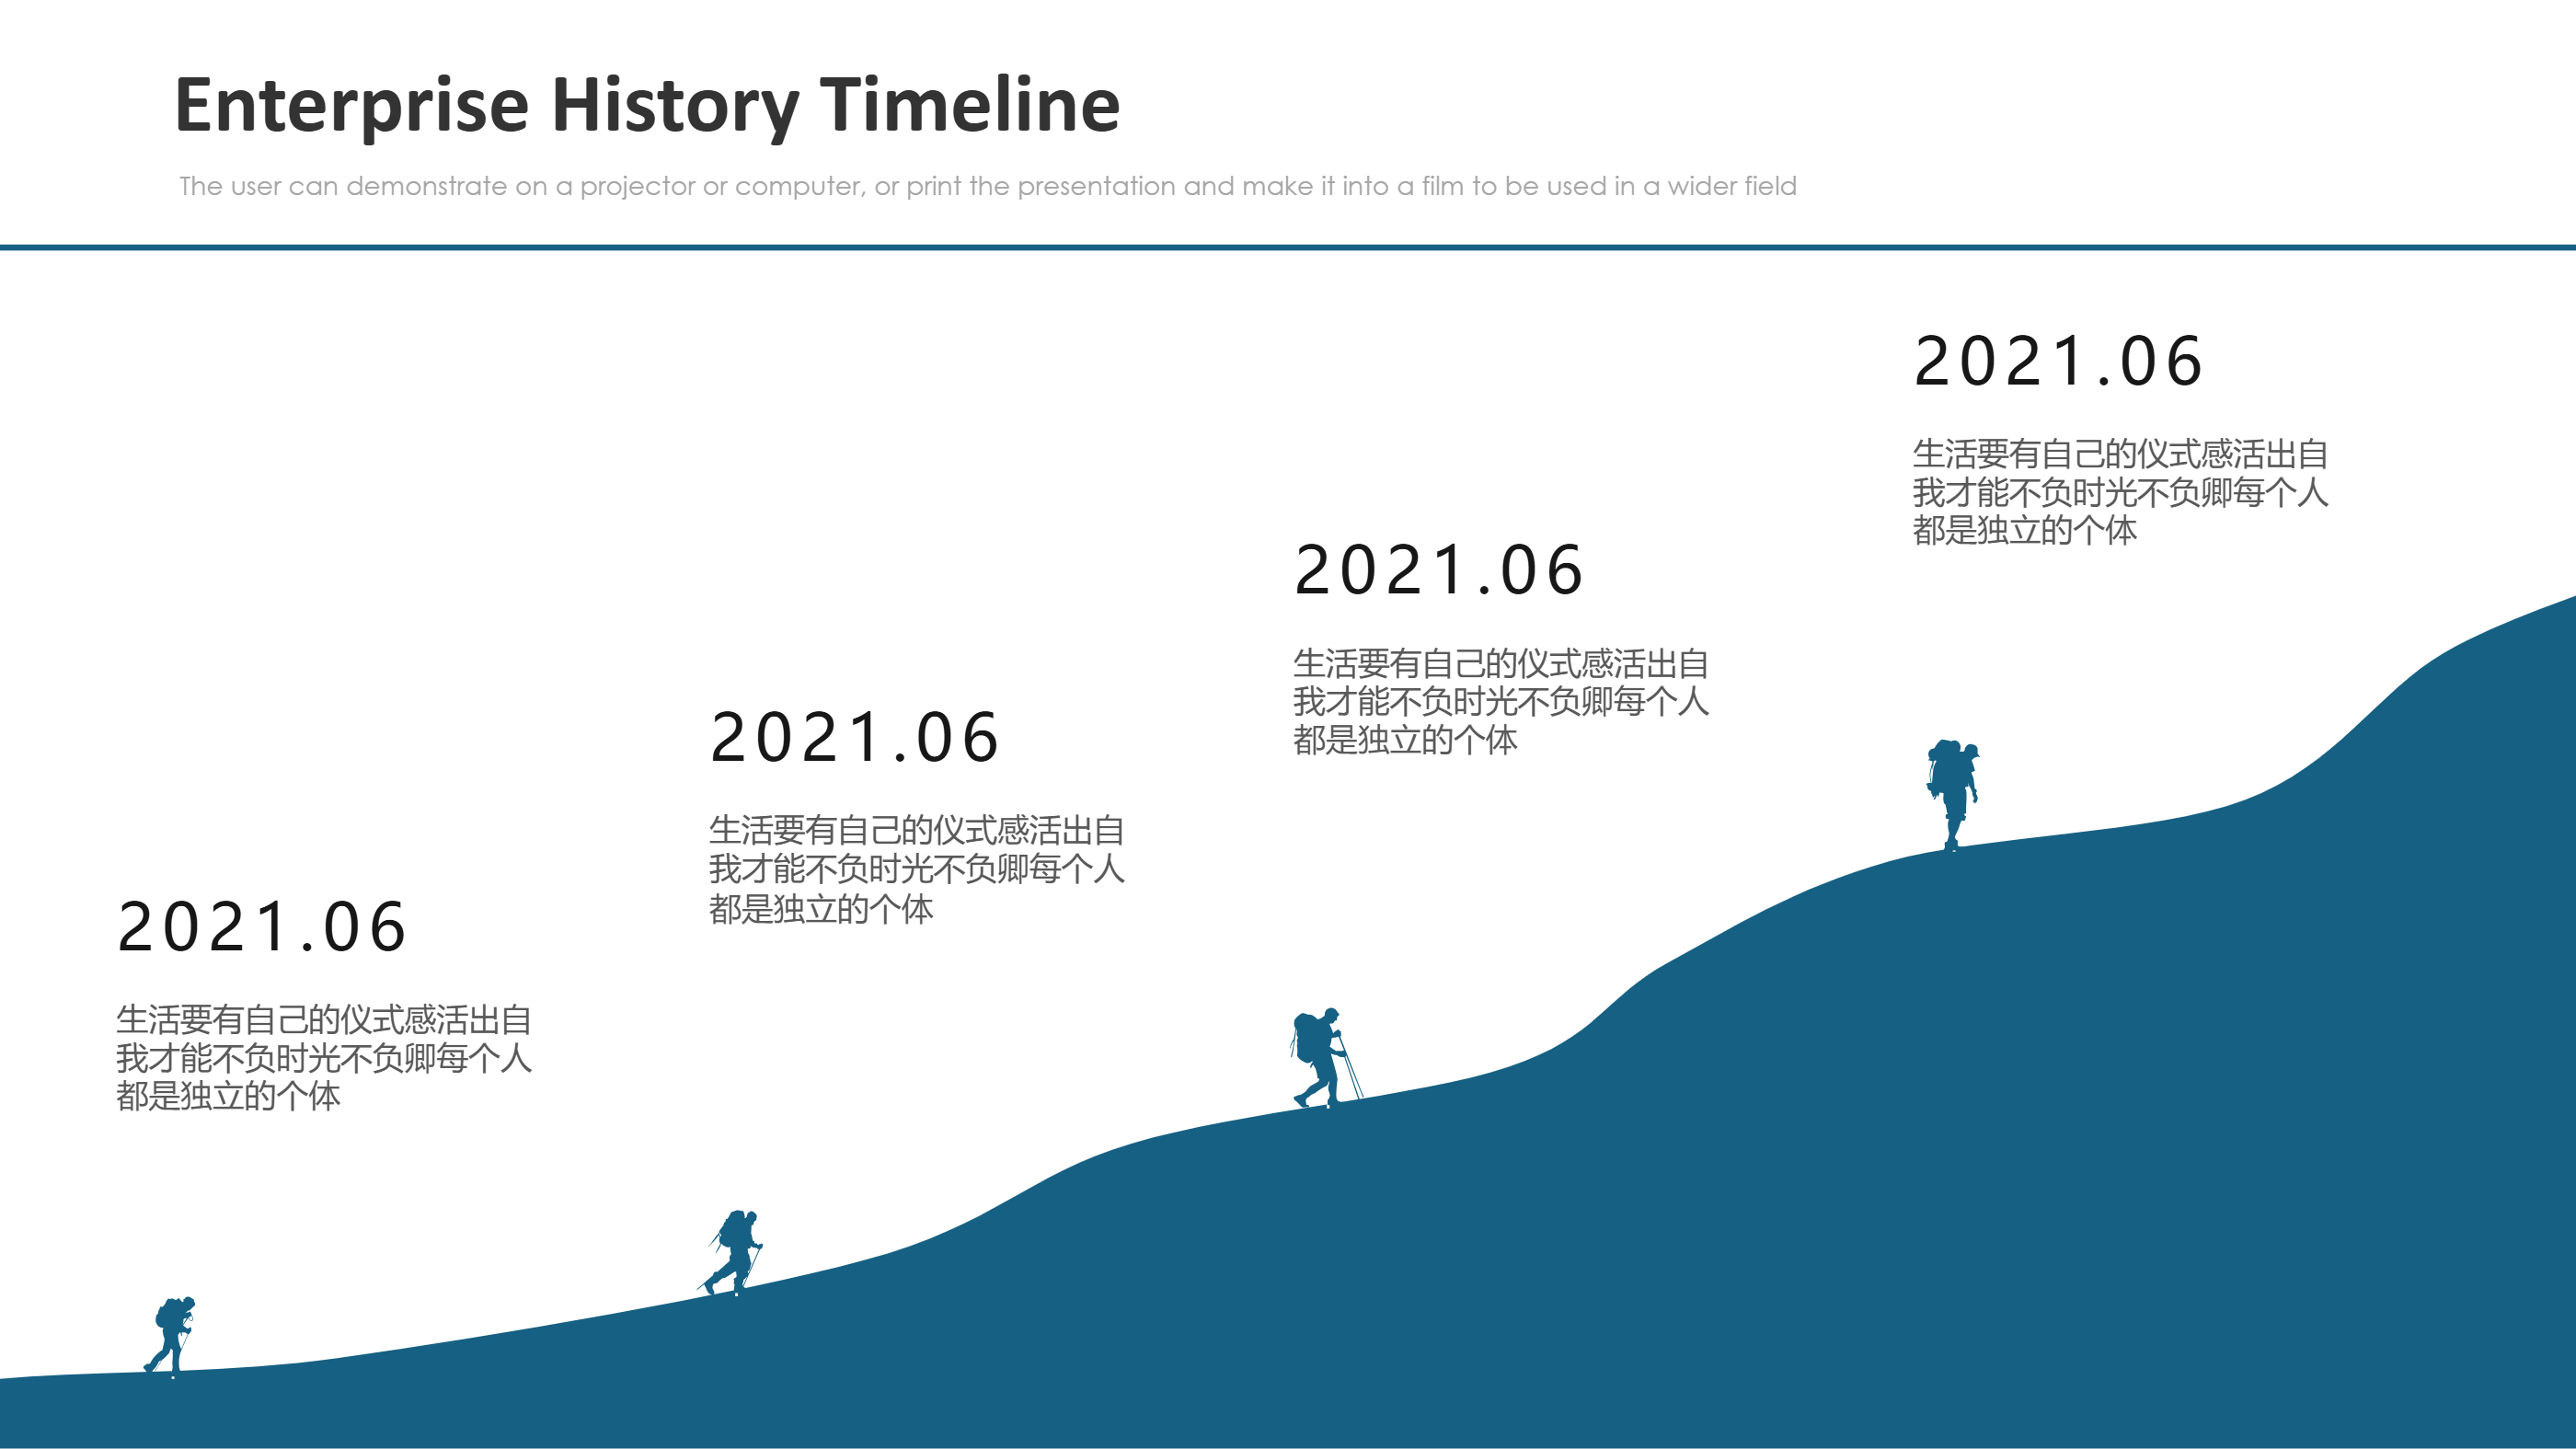
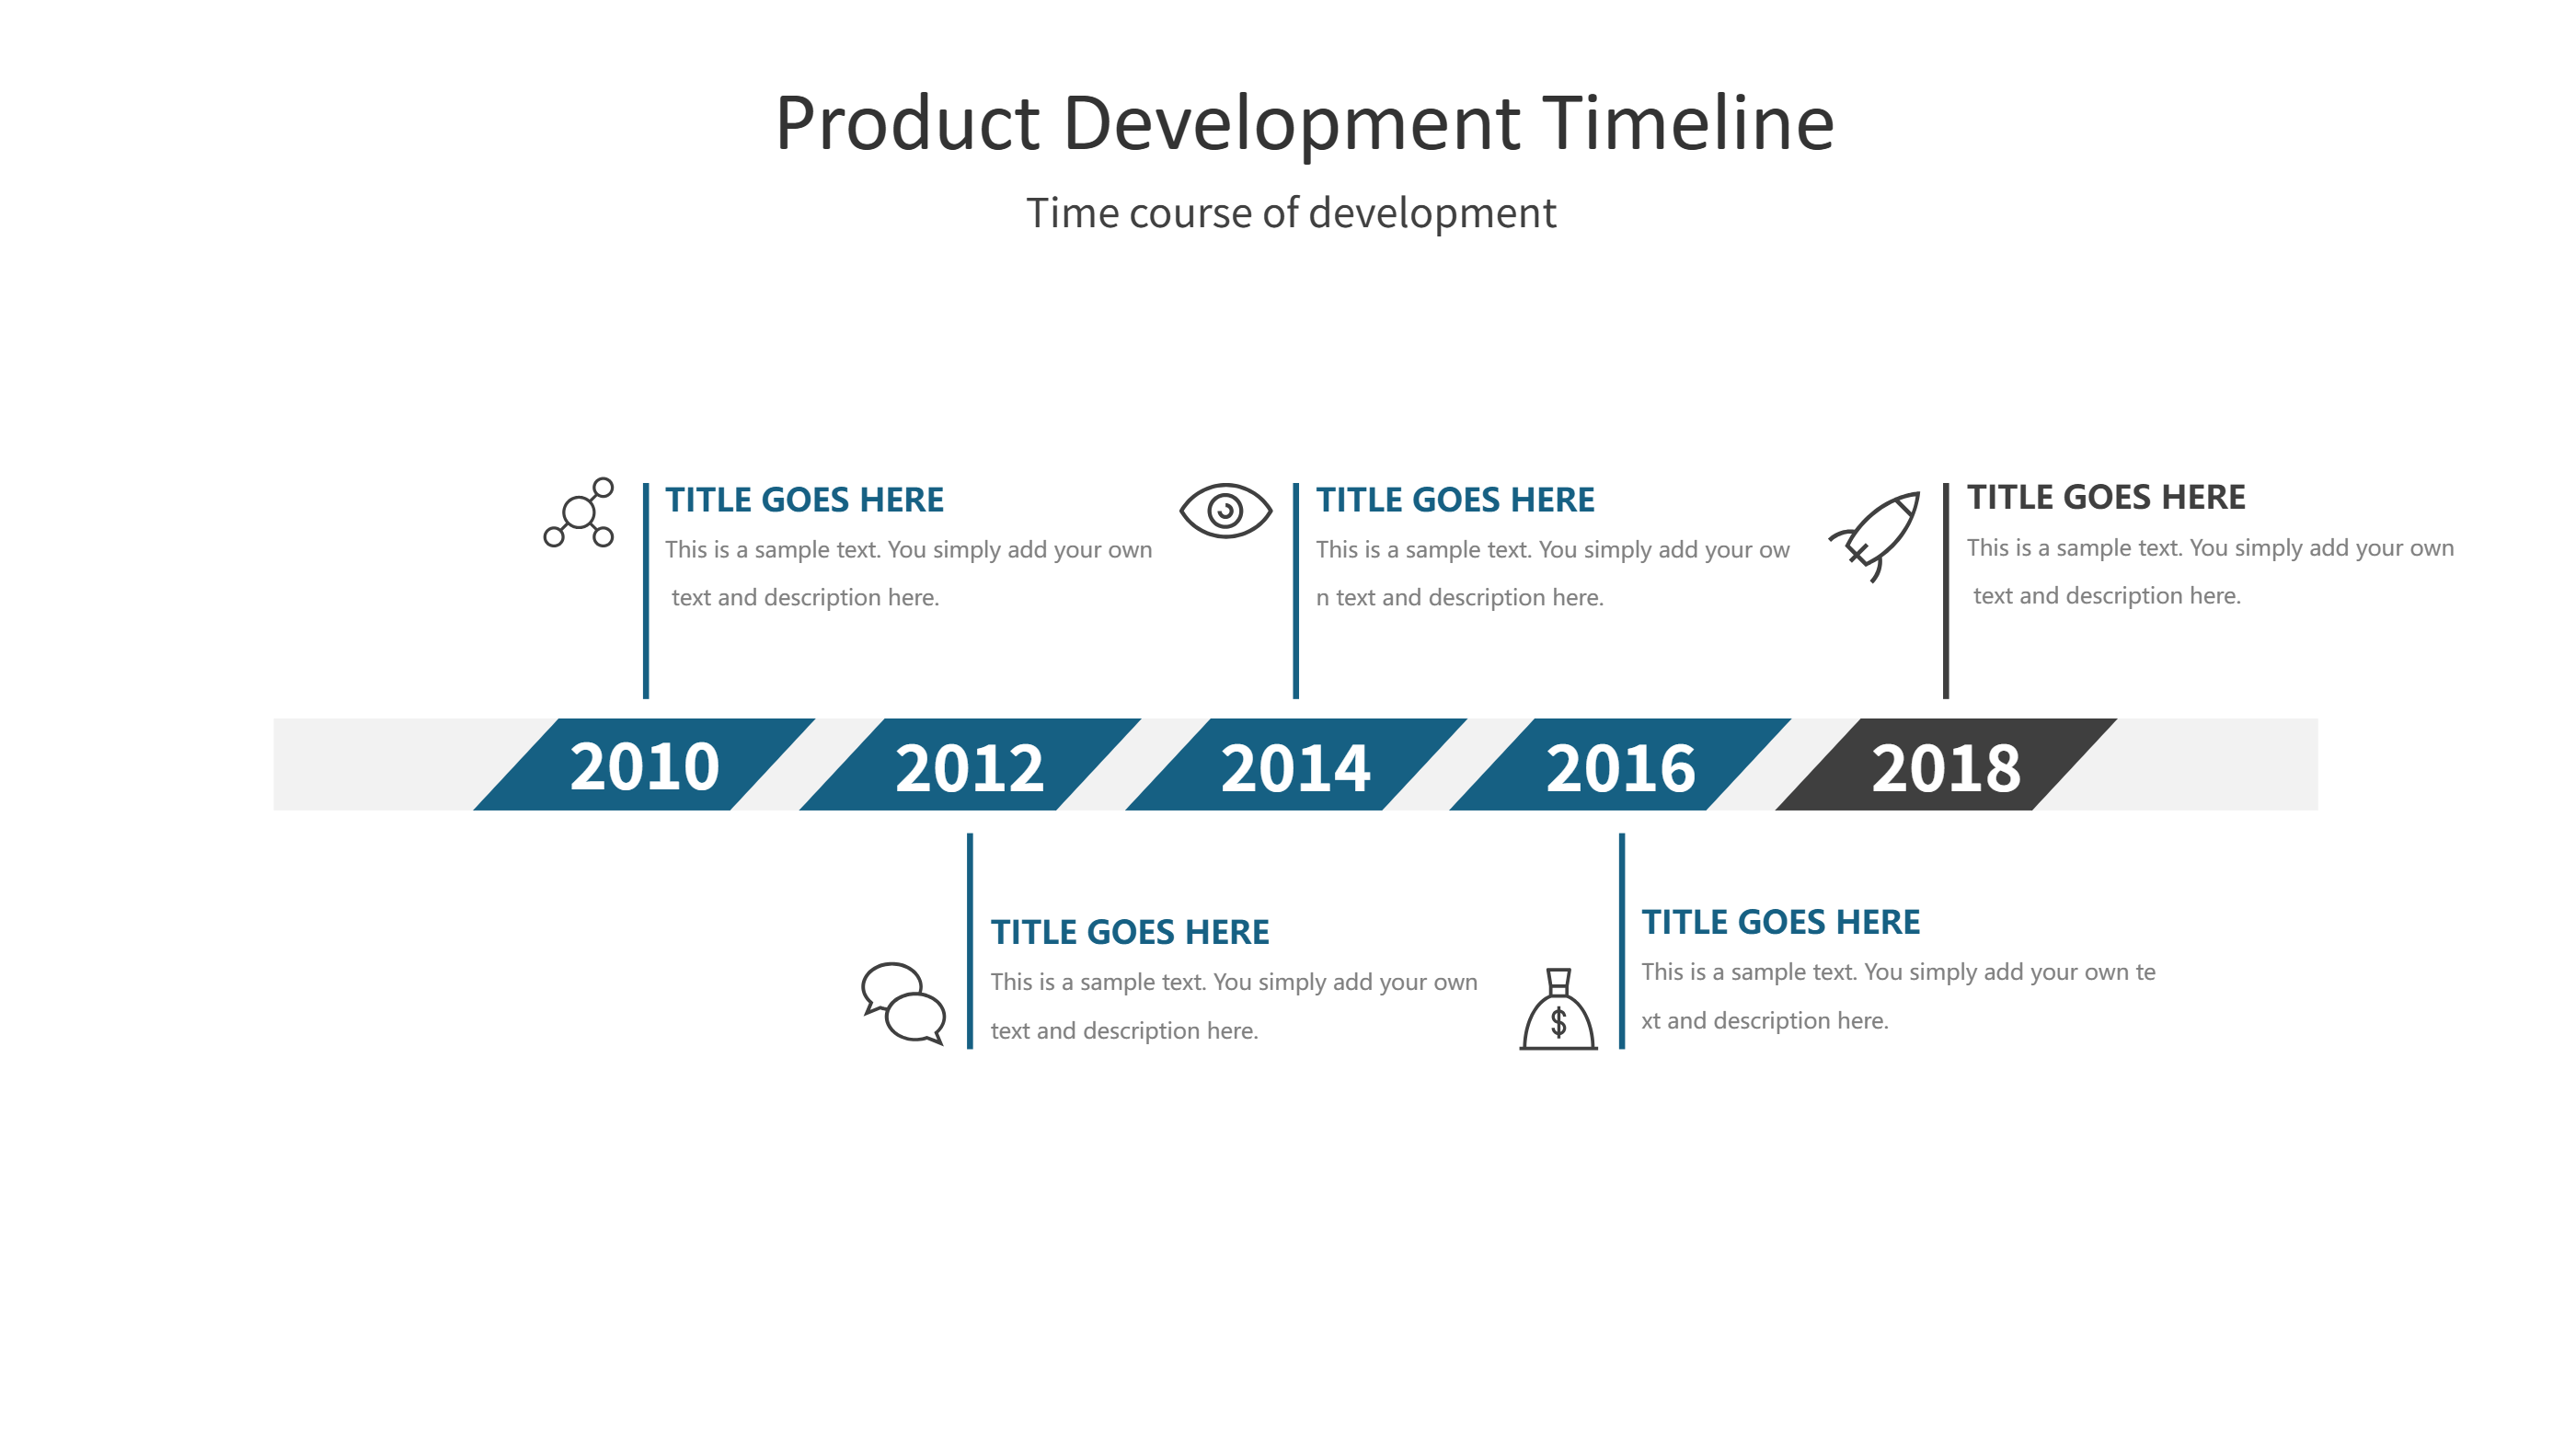
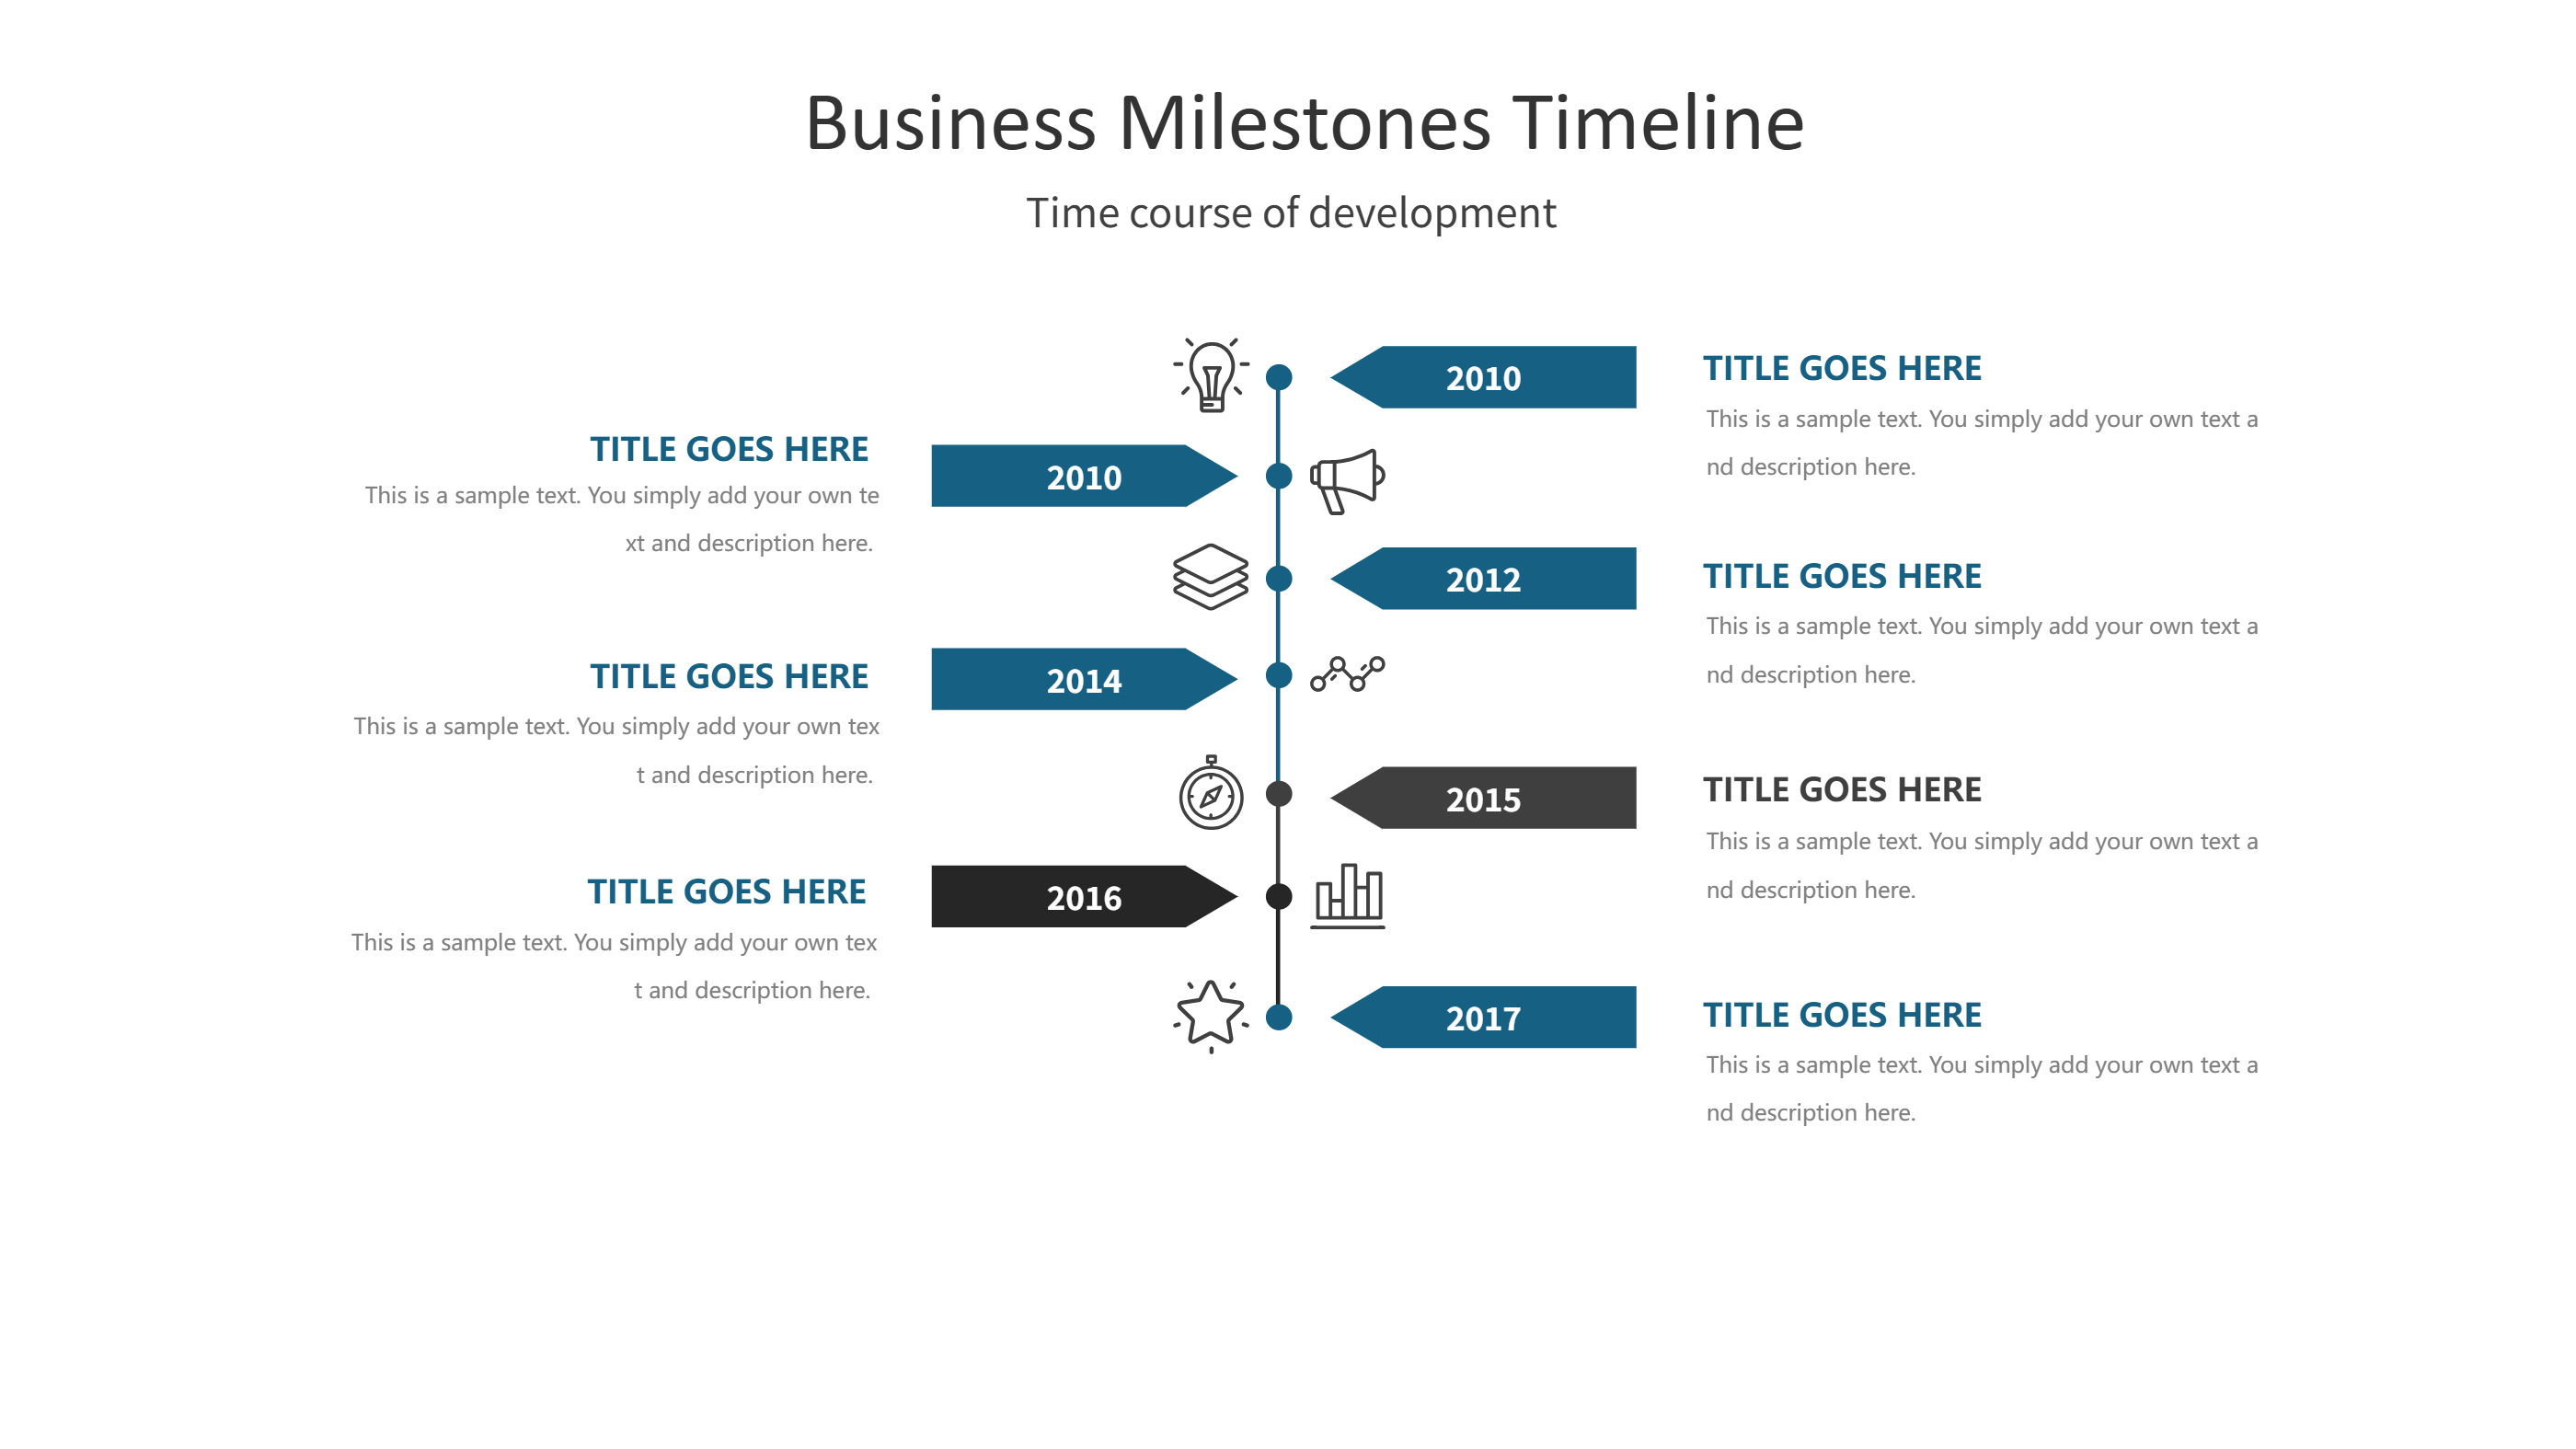
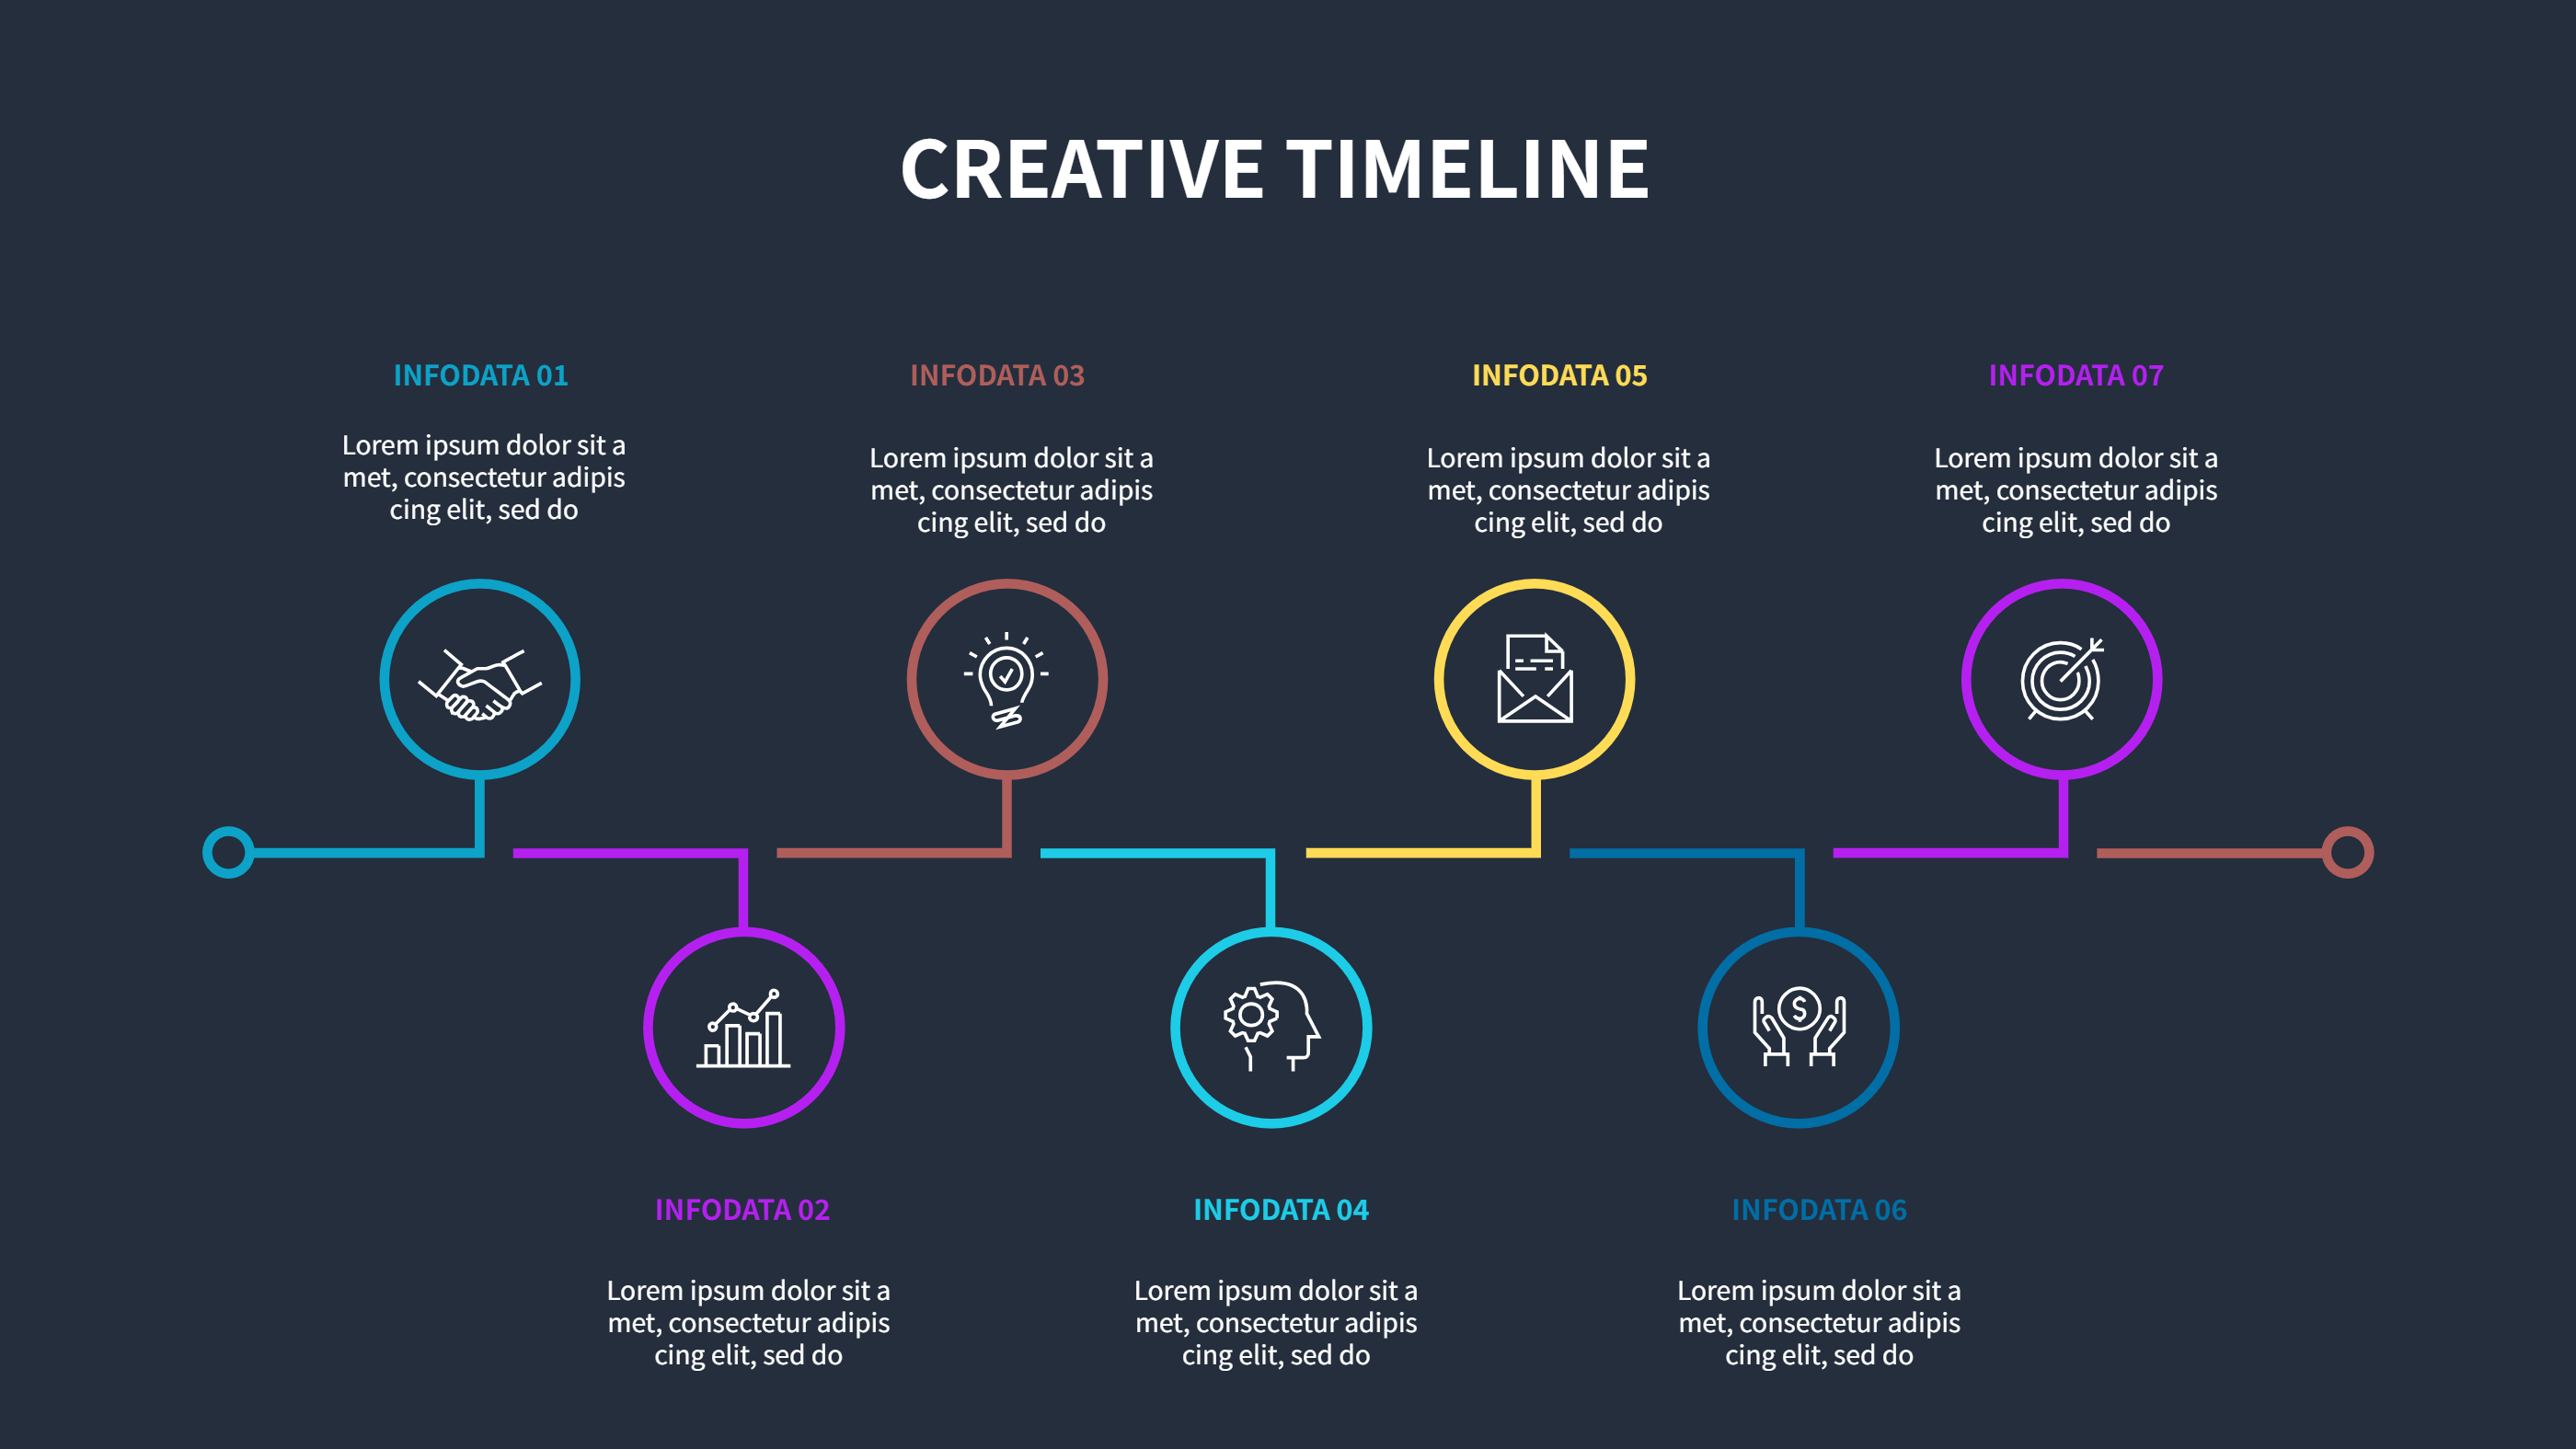
This medical case report timeline template gives you a clear, vertical path for patient stories. Circular markers climb along the line so readers can see how symptoms, tests, treatments, and outcomes stack over time. Use it for single cases, small cohorts, or follow-up summaries where dates and key actions matter. Each stop has room for a short heading and a brief note so you can show what happened, who led the step, and what changed after it.
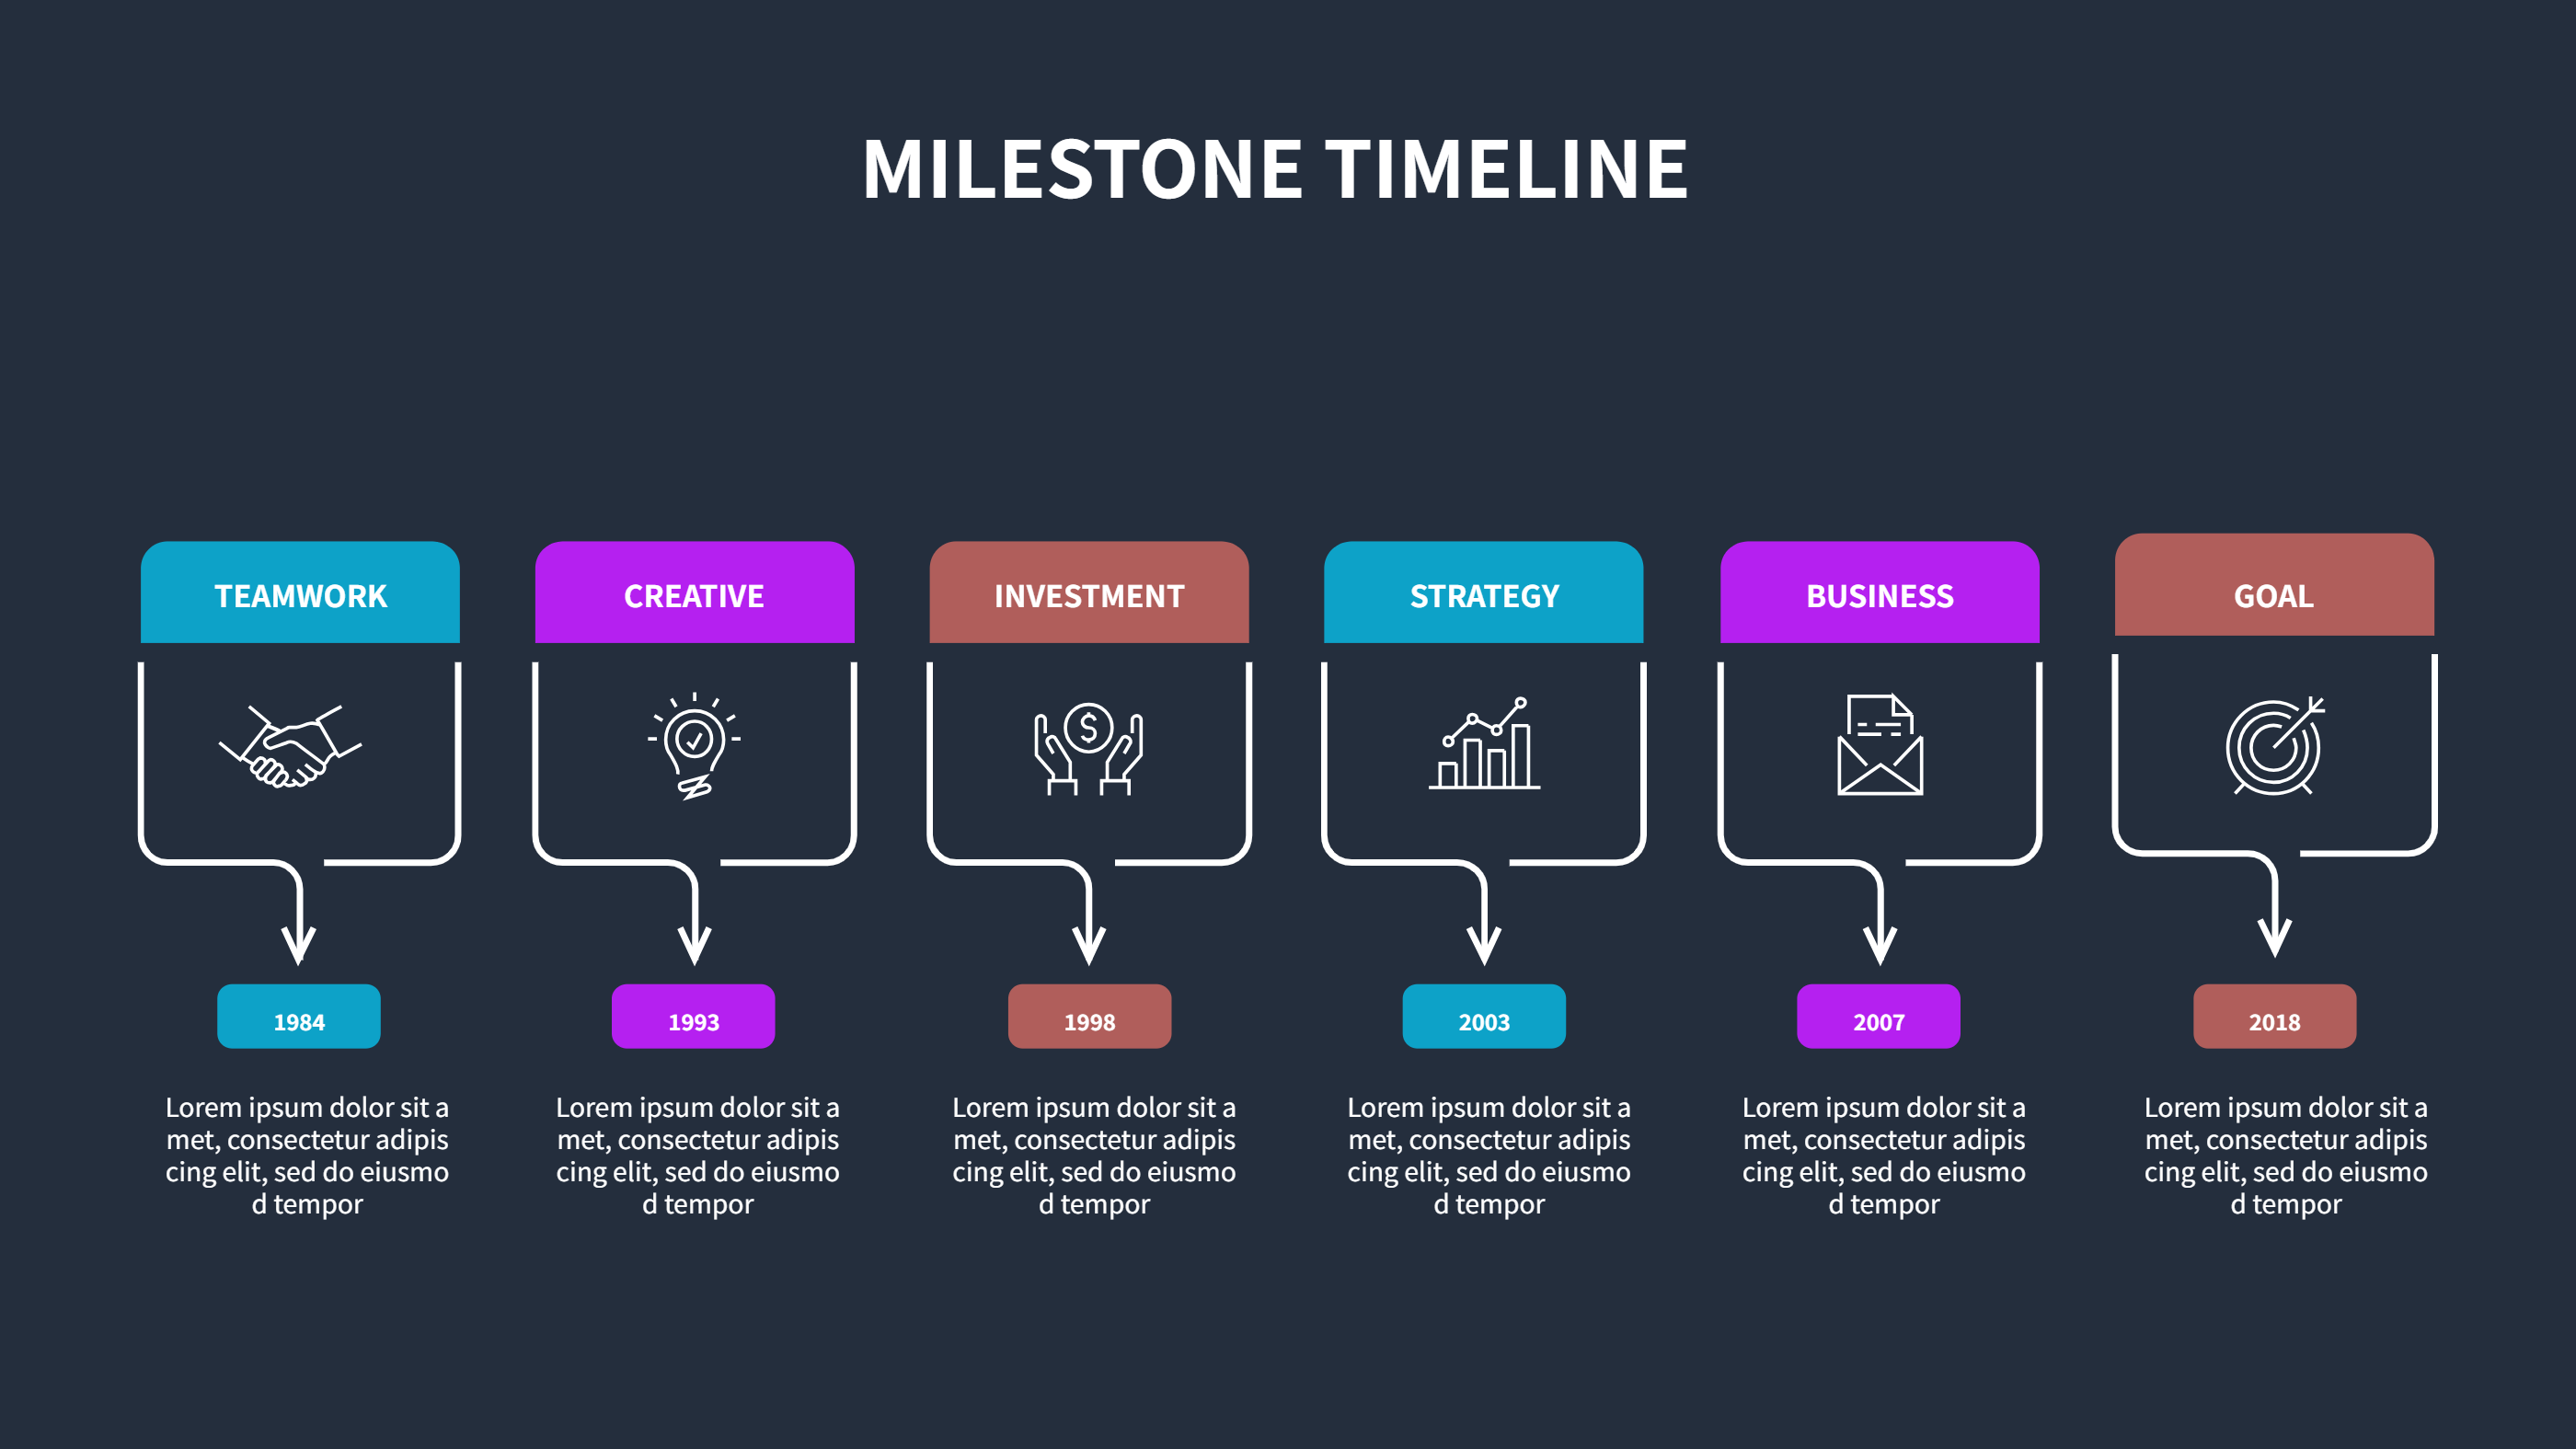
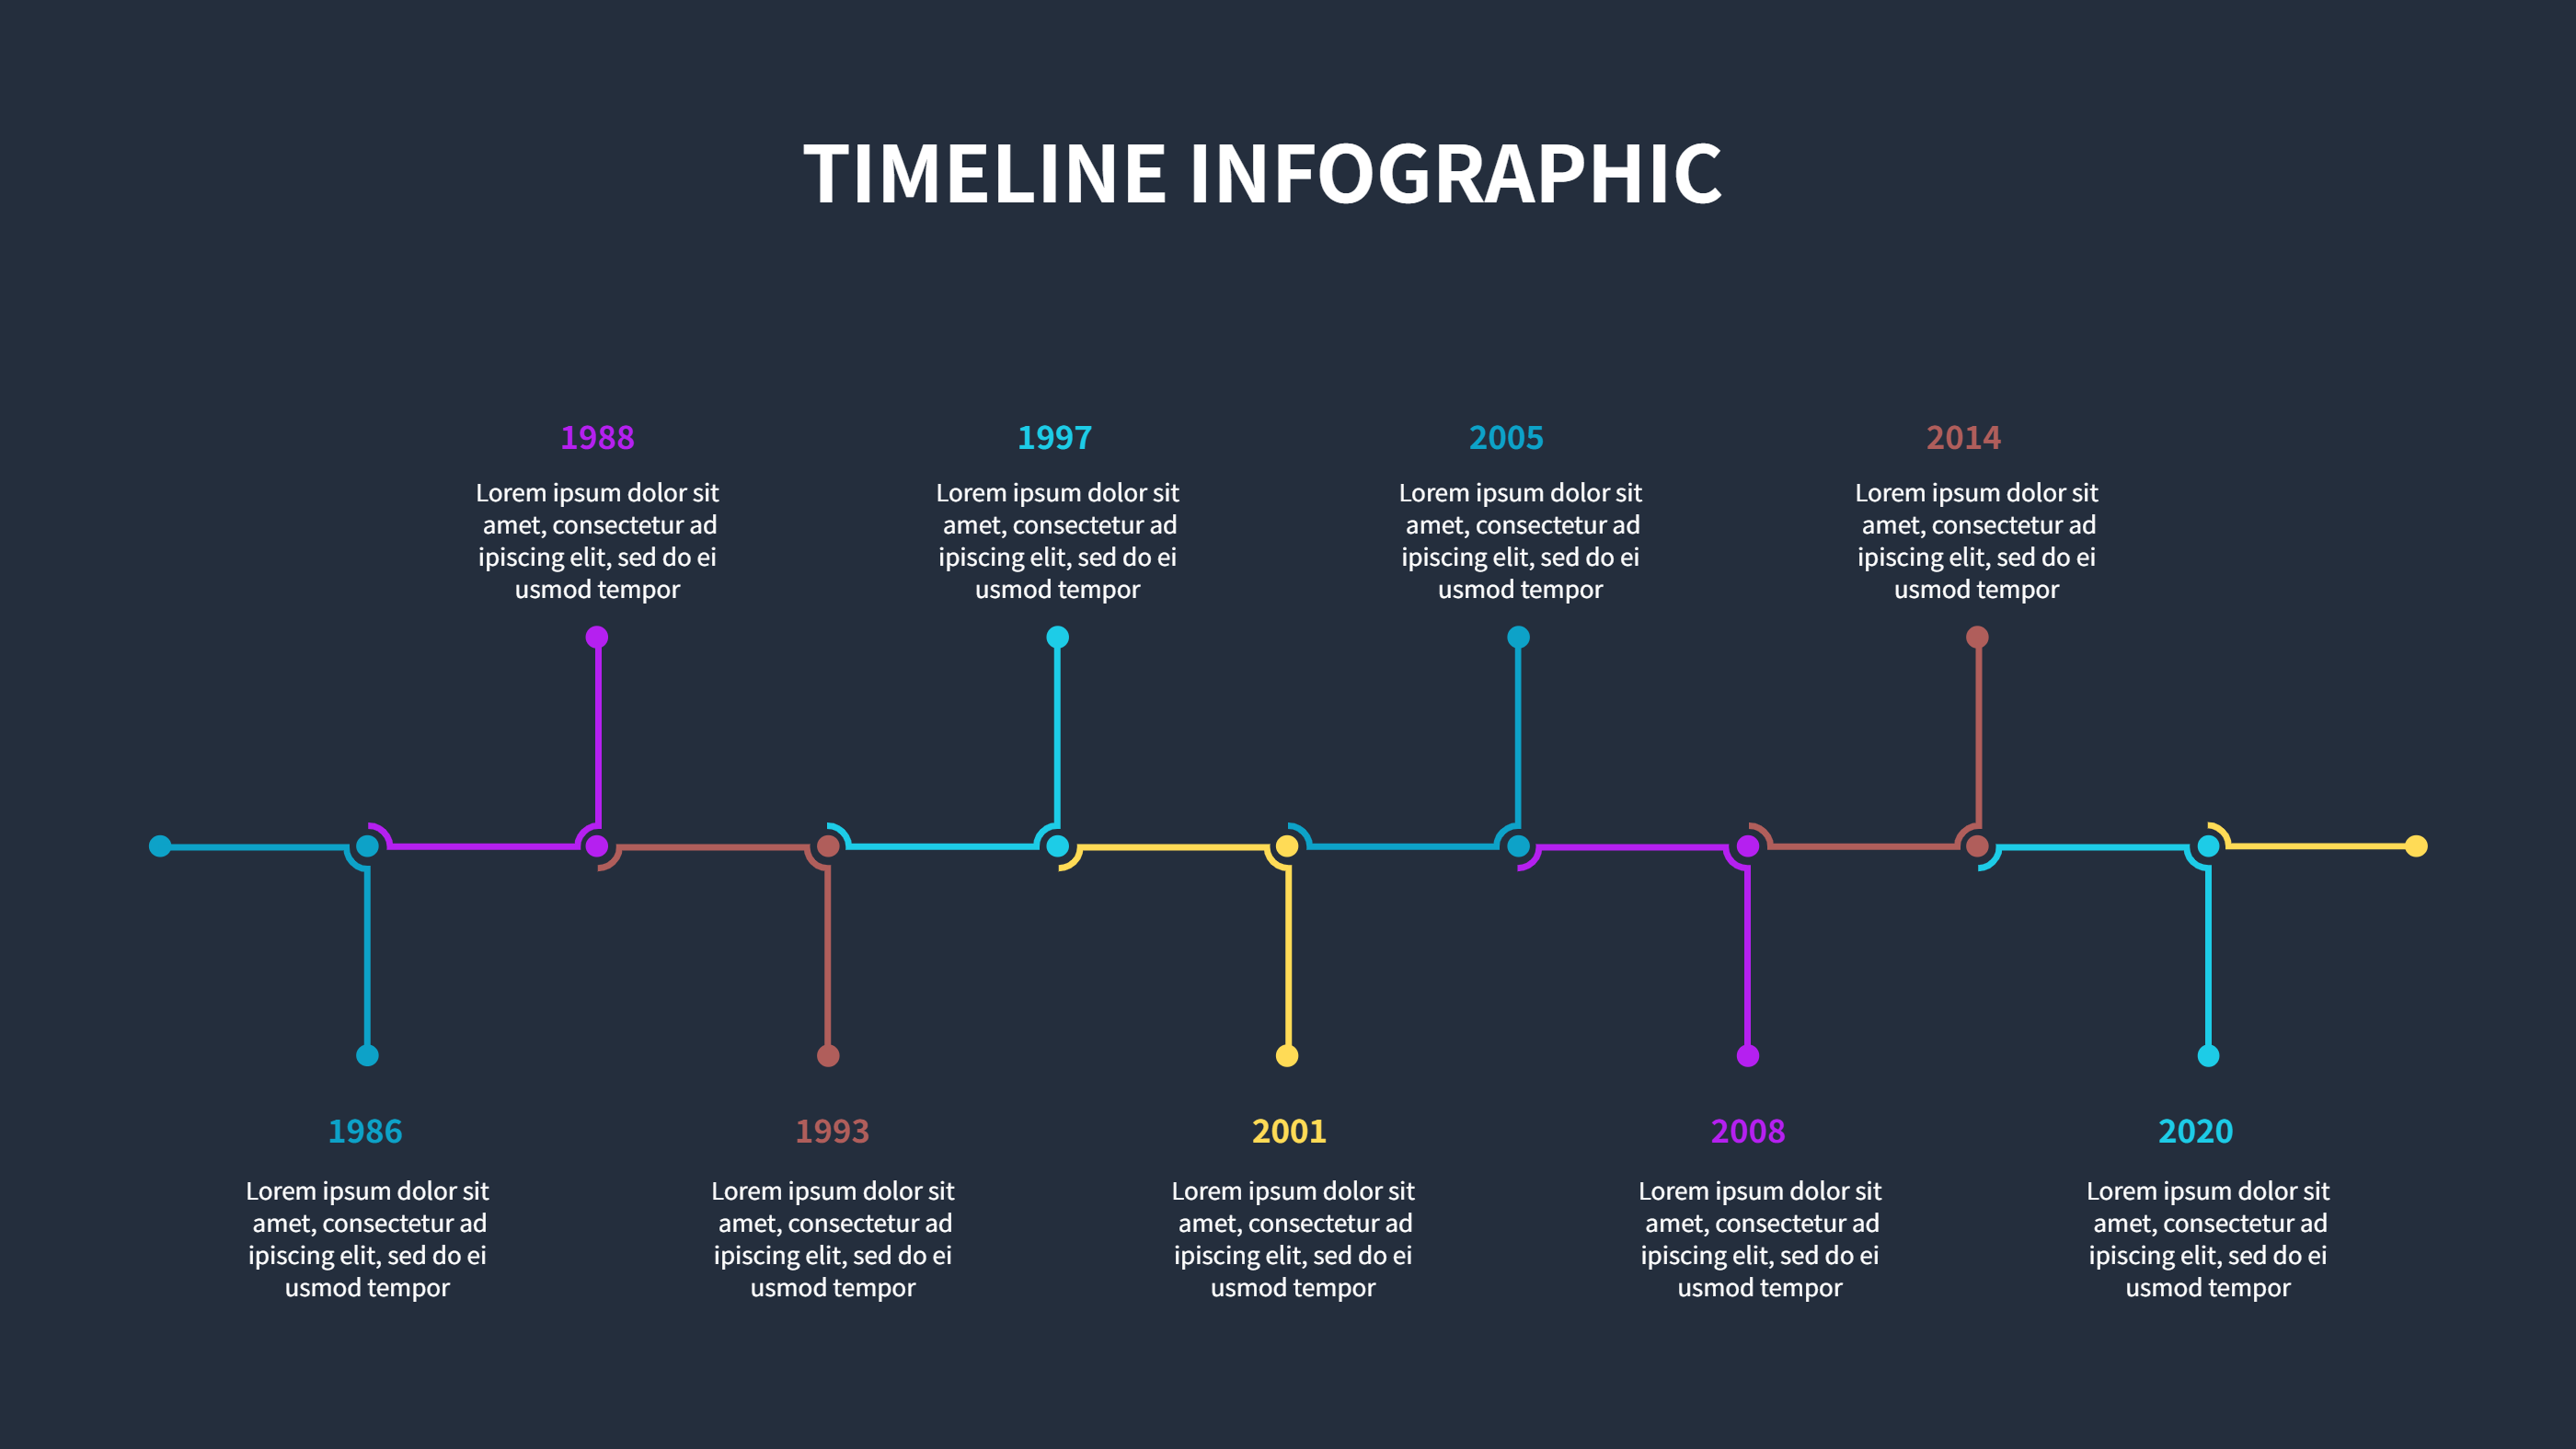
Keep language simple so clinicians, students, and families can read it fast. Add key dates, symptom notes, exam results, medication starts, and follow-up observations without loading the page with jargon. Color-code steps for diagnosis, intervention, monitoring, and recovery to make the flow easy to scan. The vertical layout fits nicely on printouts, slides, and dashboards where height is available. You can print it for handoff folders or share it as a PDF with the team.
You can reuse this layout for different specialties: surgery follow-ups, chronic disease timelines, rehab plans, or discharge summaries. Swap icons to match lab checks, imaging, consults, or therapy milestones. Because the markers are evenly spaced, you can shorten or lengthen the sequence without breaking the structure. The simple shapes stay clear when projected in a room or viewed on tablets.
Open the AI creation tool on the homepage, choose this template, and enter your prompt to generate the infographic automatically. This case timeline keeps the sequence clear, reduces rewrite time, and gives every reader a quick view of the medical journey.