Stock Analysis Template PDF for Simple Performance Review
What is Stock Analysis Template PDF Infographic
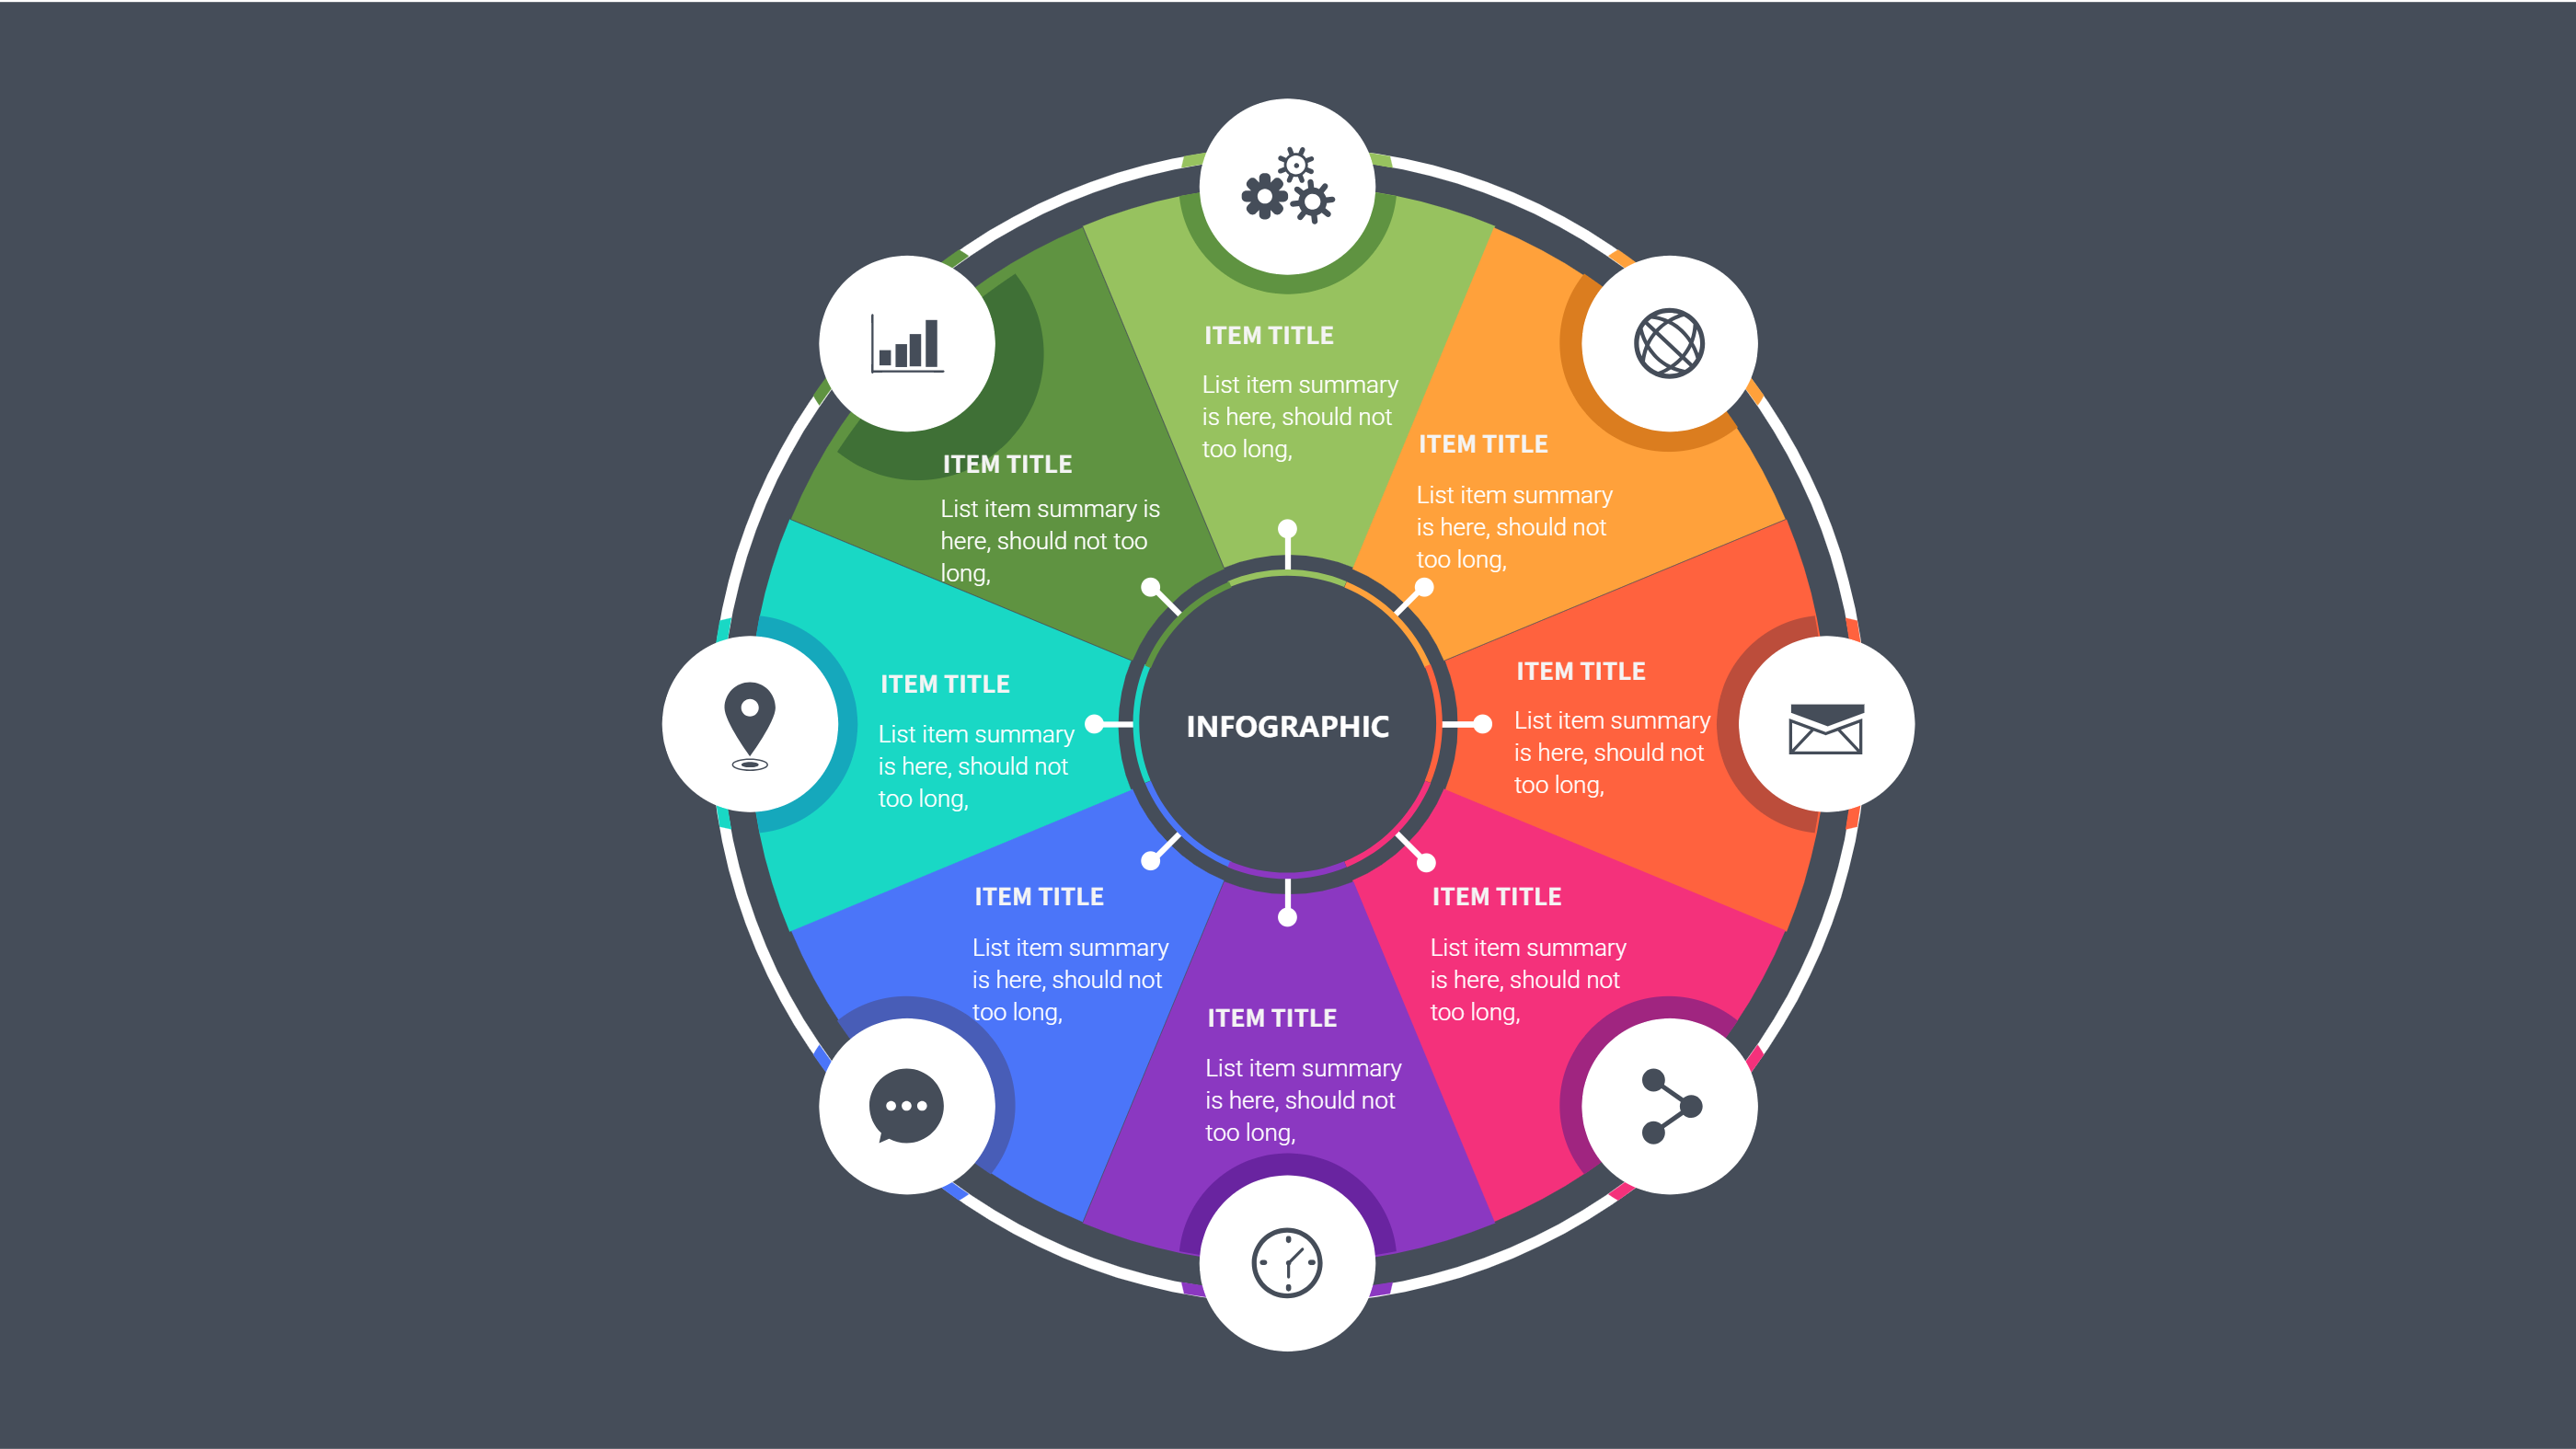
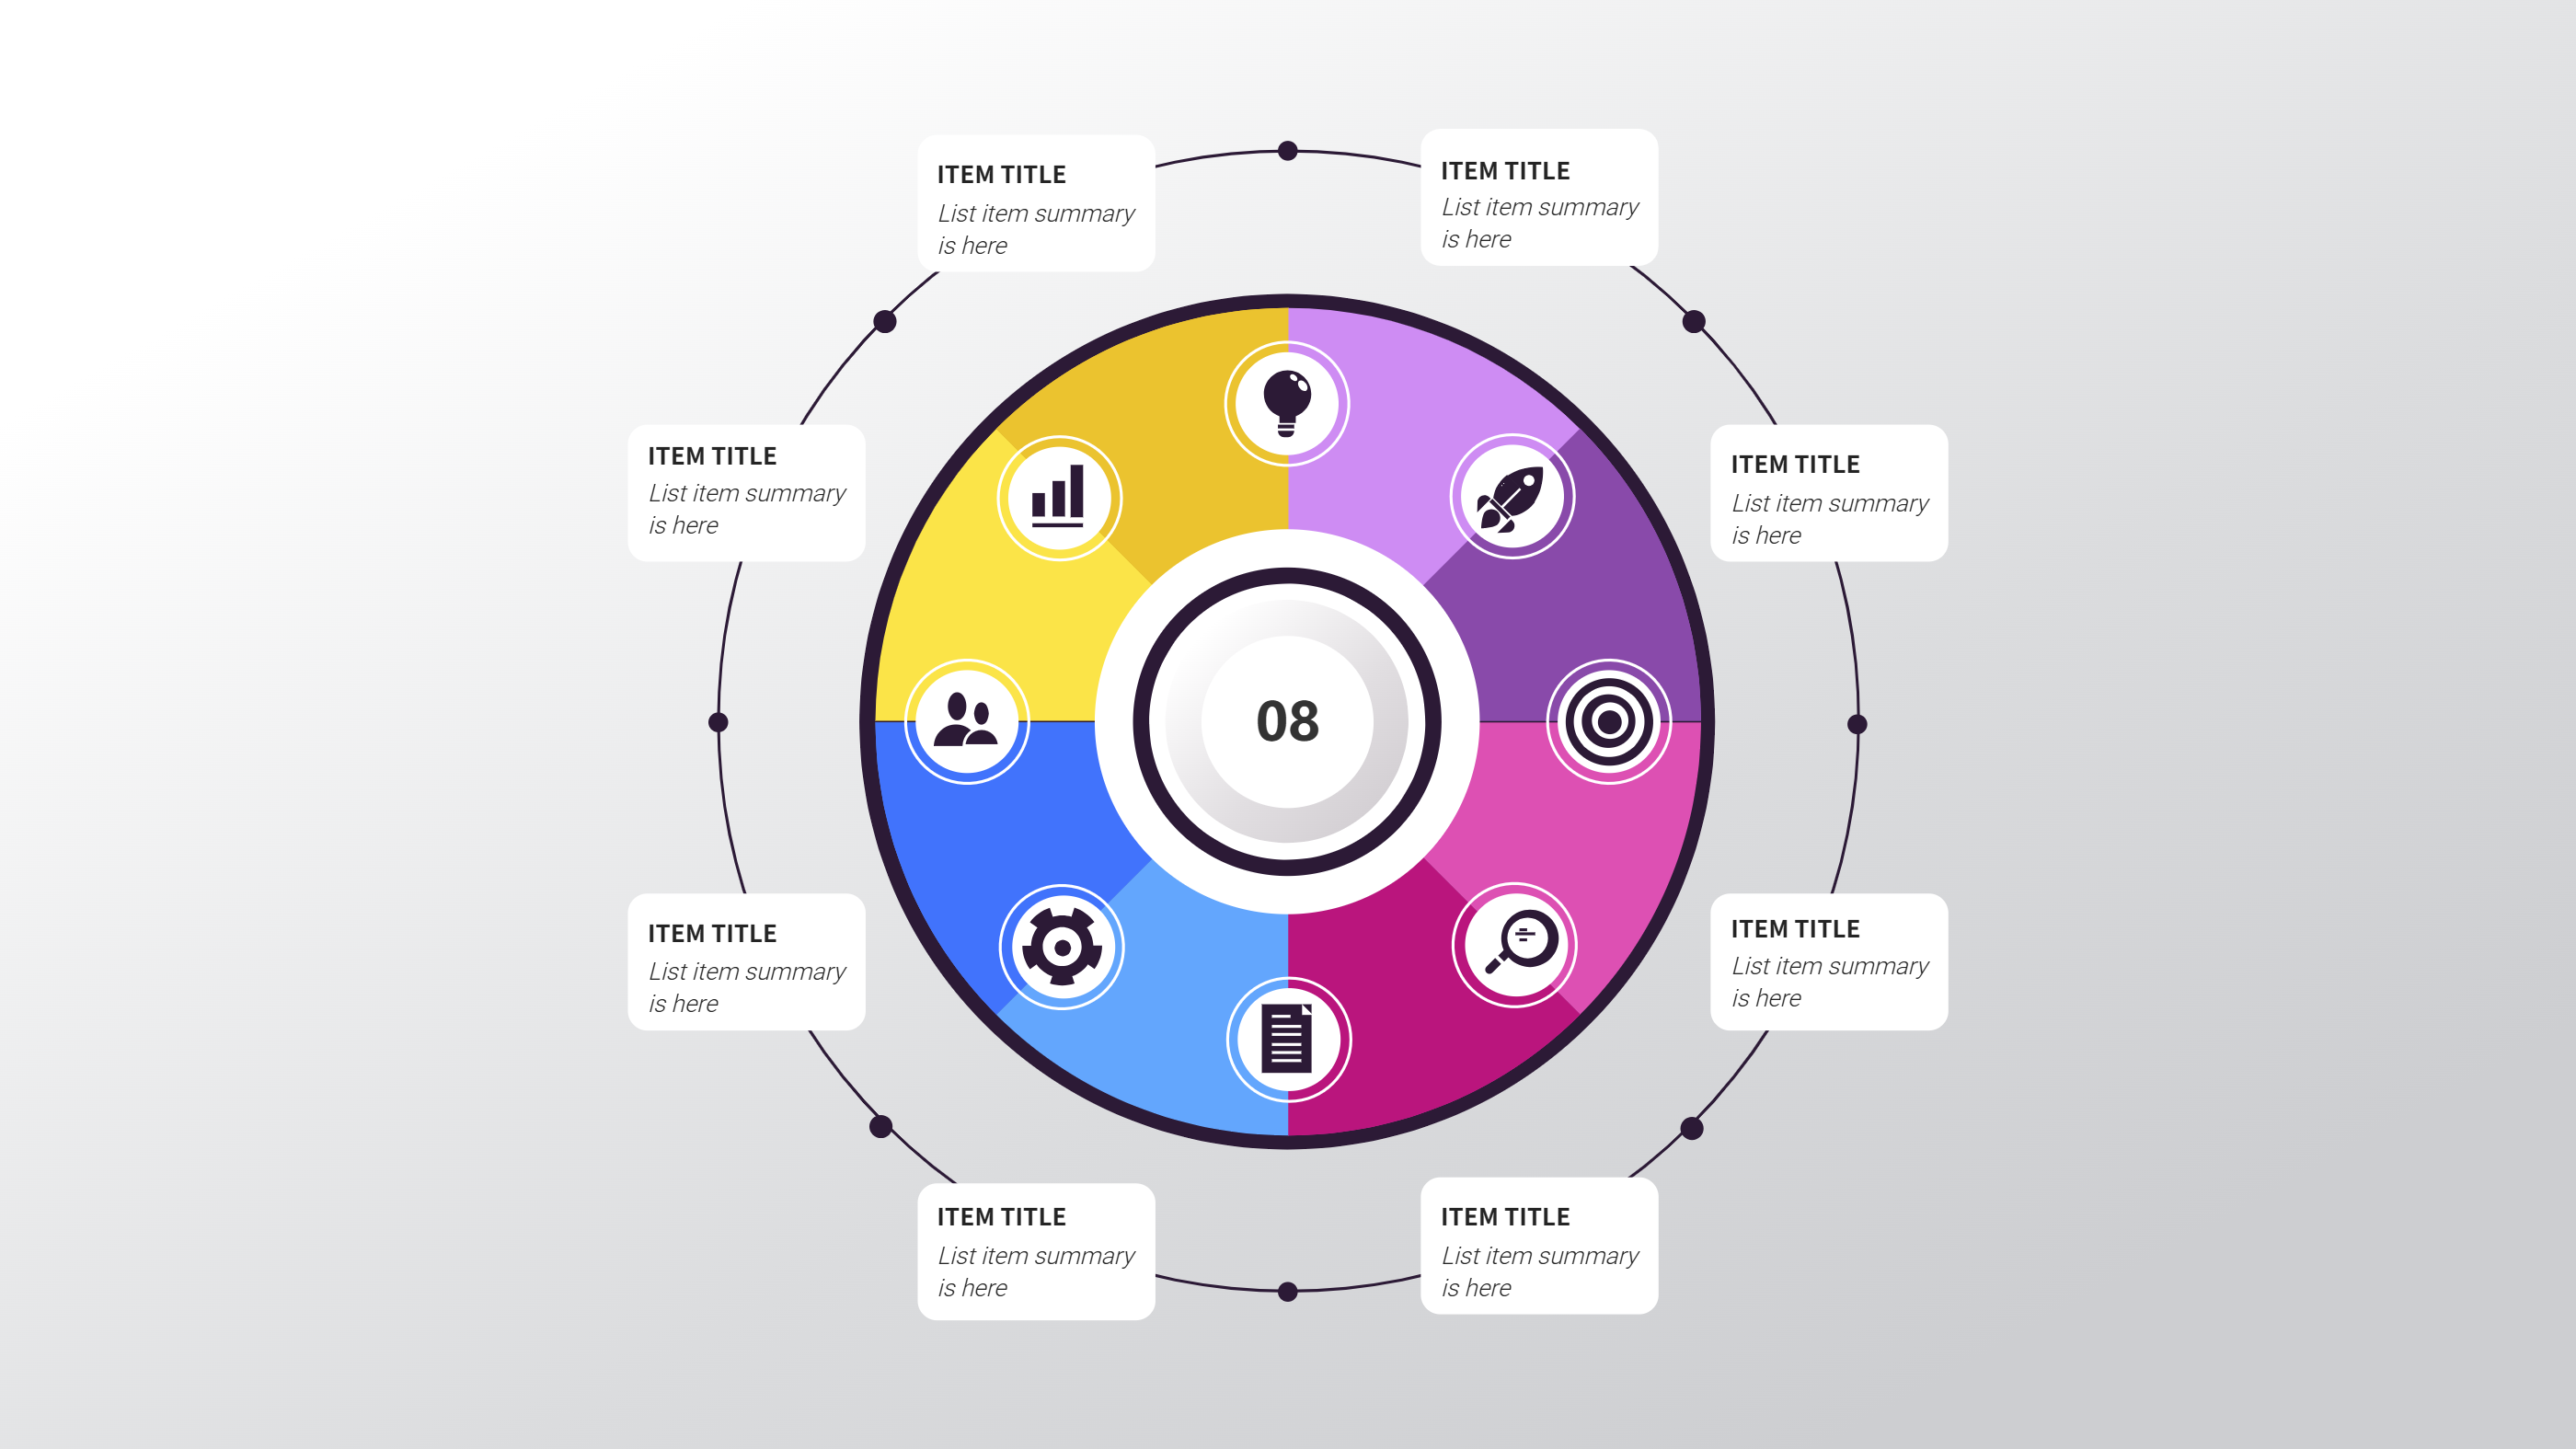
A stock analysis template PDF infographic is a clear layout that shows stock performance in one page. It can show price trends, simple charts, and key notes. It keeps numbers in a neat grid and uses short labels. It helps a reader compare performance without digging into a long report. It is a template page, not a long article.
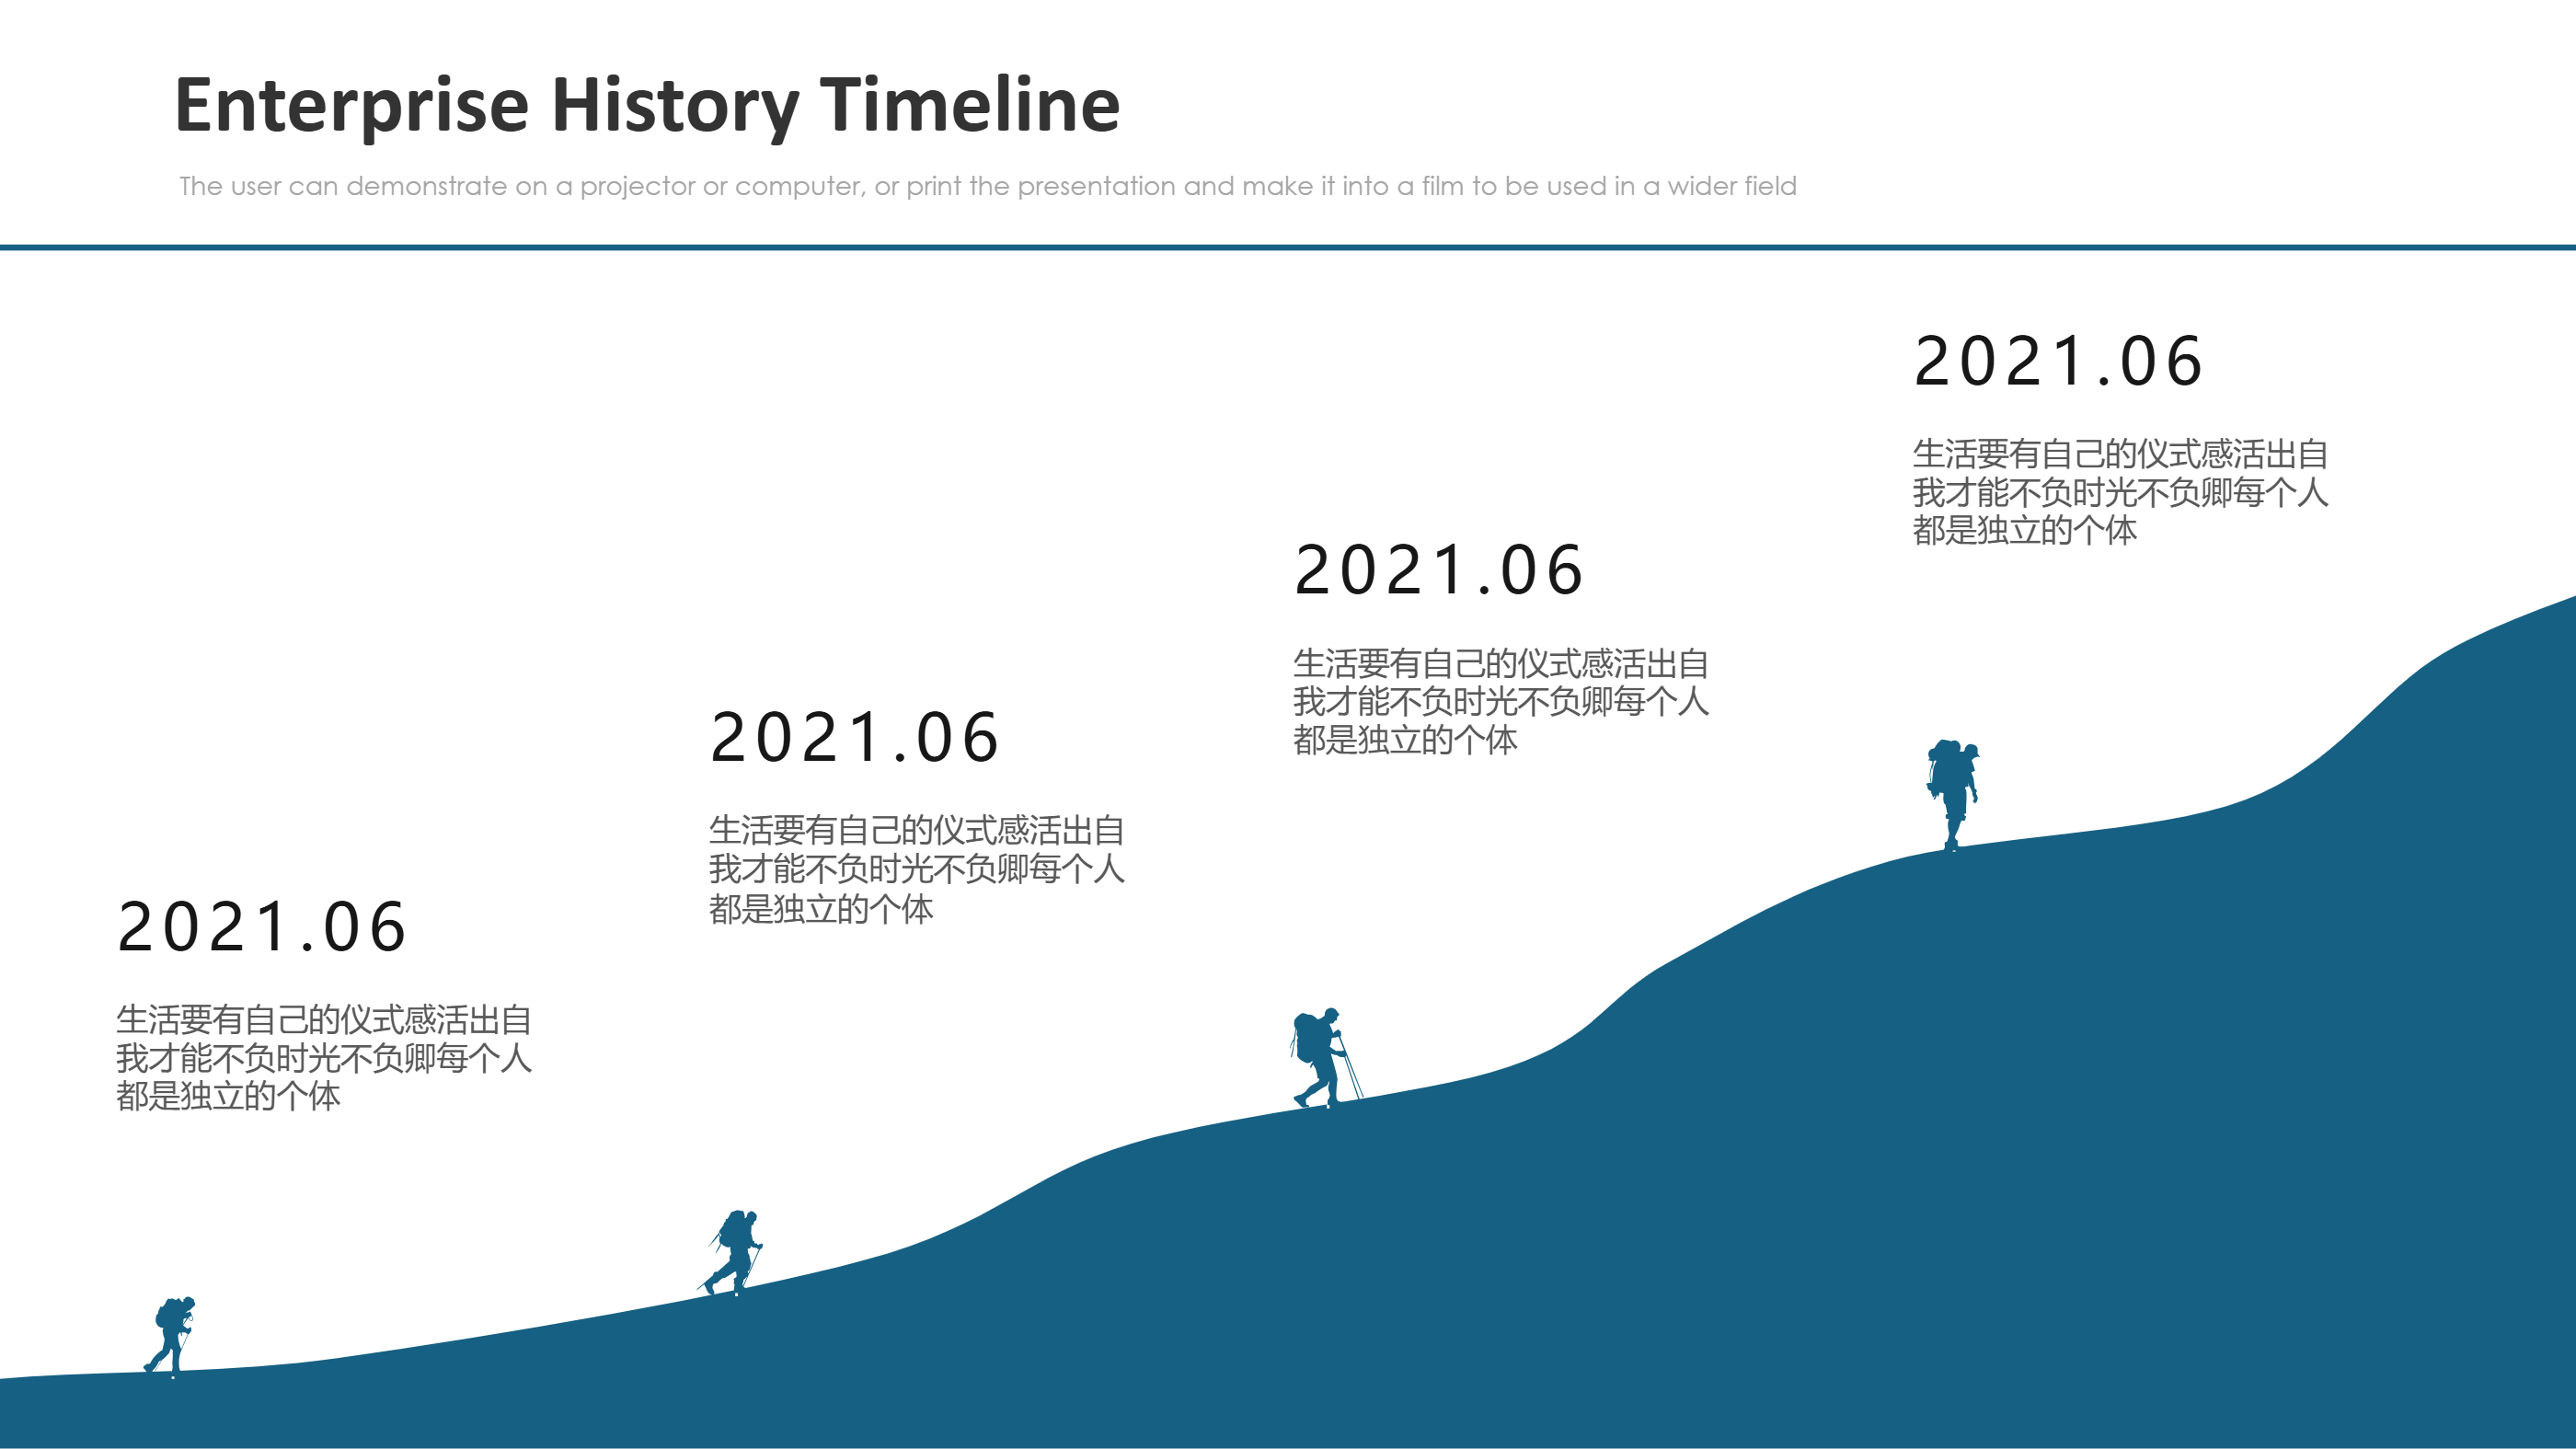
The template is useful for personal investing notes, small team updates, or class projects. It can show a watch list, a short summary, and a few charts on the same page. It can also highlight a time range such as a month or a quarter. The design keeps the view clean so the reader can focus on change over time.
When to Use Stock Analysis Template PDF Infographic
Use this infographic when you need a quick review of stocks and trends. It works for a monthly update, a portfolio check, or a short review for a client. It is good for comparing a few stocks side by side. It is also useful when you need to explain changes to a team with limited time.
It can also help when you want to share a report as a PDF. A single page is easy to email and easy to print. The layout is clear for meetings or study groups. It keeps the key points visible and avoids long paragraphs. It is a smart option for any simple review.
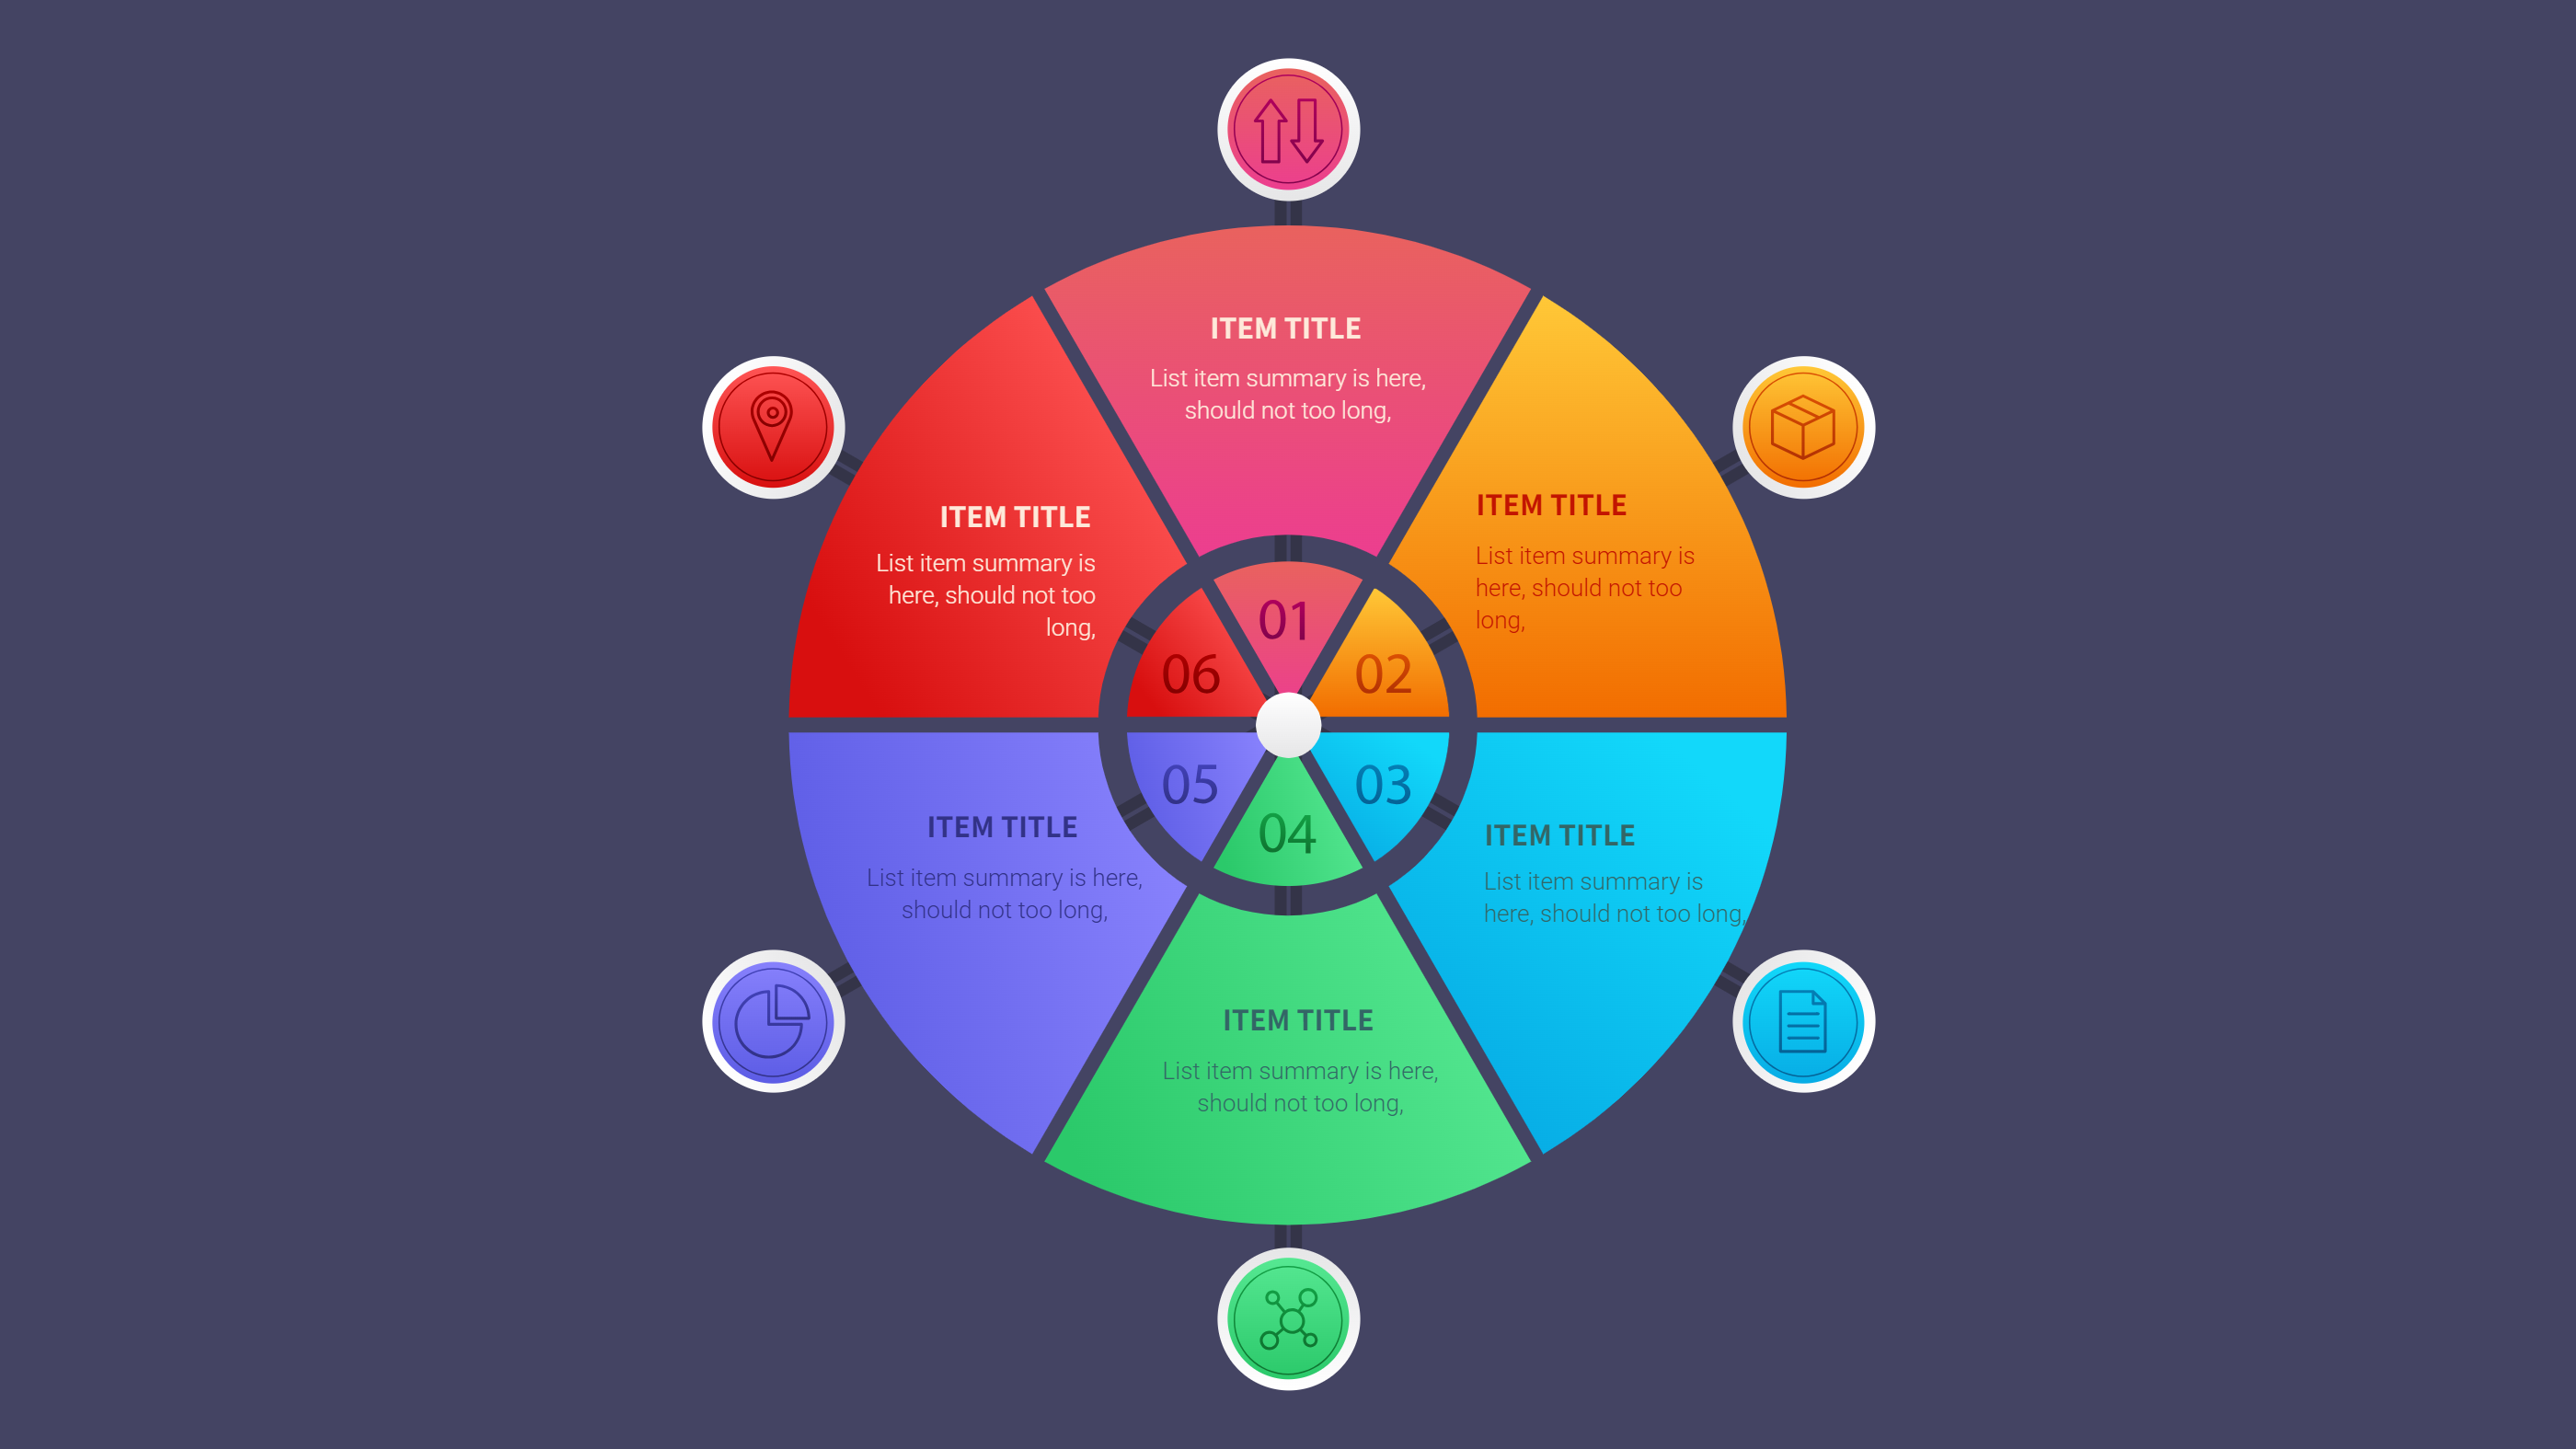
Download and Edit the Template
Click the download button and an online editor opens in a new page. You can edit chart labels, numbers, and short notes. You can adjust colors and icons to match your brand or theme. Use the save button when you are done. Choose PPT, PNG, or SVG as the export format. The steps stay the same even if the wording is different.
How to Use Stock Analysis Template PDF for Simple Performance Review
Open the AI generator on the home page and choose the stock analysis template. Enter a short prompt that names the stocks, the time range, and the key metrics you want to show. The tool creates an infographic that follows the layout. You can edit the result and adjust text to match your data. The meaning stays the same, even if your wording changes.
Examples of Stock Analysis Template PDF AI Prompt Usage
Example 1:
A monthly portfolio summary with four stocks and a simple line chart for each. Include a short note on price change and a small table for the month high and low.
Example 2:
A sector comparison infographic that shows tech, health, and energy groups. Use three small charts and a short note that highlights the strongest and weakest group.
Example 3:
A watch list page with five stocks, each with a trend arrow and a short comment. Add a small bar chart for volume and a note on the recent news.
Recommended Similar Infographic Templates
Related Template 1: NGL Stock Chart Market Snapshot Template
Related Template 2: Finance Investment Visualization
Related Template 3: Finance Market Share Piechart Infographic Template
Related Template 4: Metabase Dashboard Templates for Simple PPT Infographics
Related Template 5: 5 Business & Market Analysis
FAQs
Q: Can I use this template for a personal portfolio review?
A: Yes, it works well for personal notes and small updates.
Q: Can I include more than one chart type on the page?
A: Yes, you can mix line charts and bars in the same layout.
Q: Is this suitable for printing as a PDF?
A: Yes, the design is built for a clean single page view.
Q: Can I edit the colors for a dark or light theme?
A: Yes, colors and fonts can be changed in the editor.
Q: Can I export the result as a PNG for sharing?
A: Yes, PNG export is available in the editor.