Metabase Dashboard Templates for Simple PPT Infographics
What is Metabase Dashboard Templates Infographic
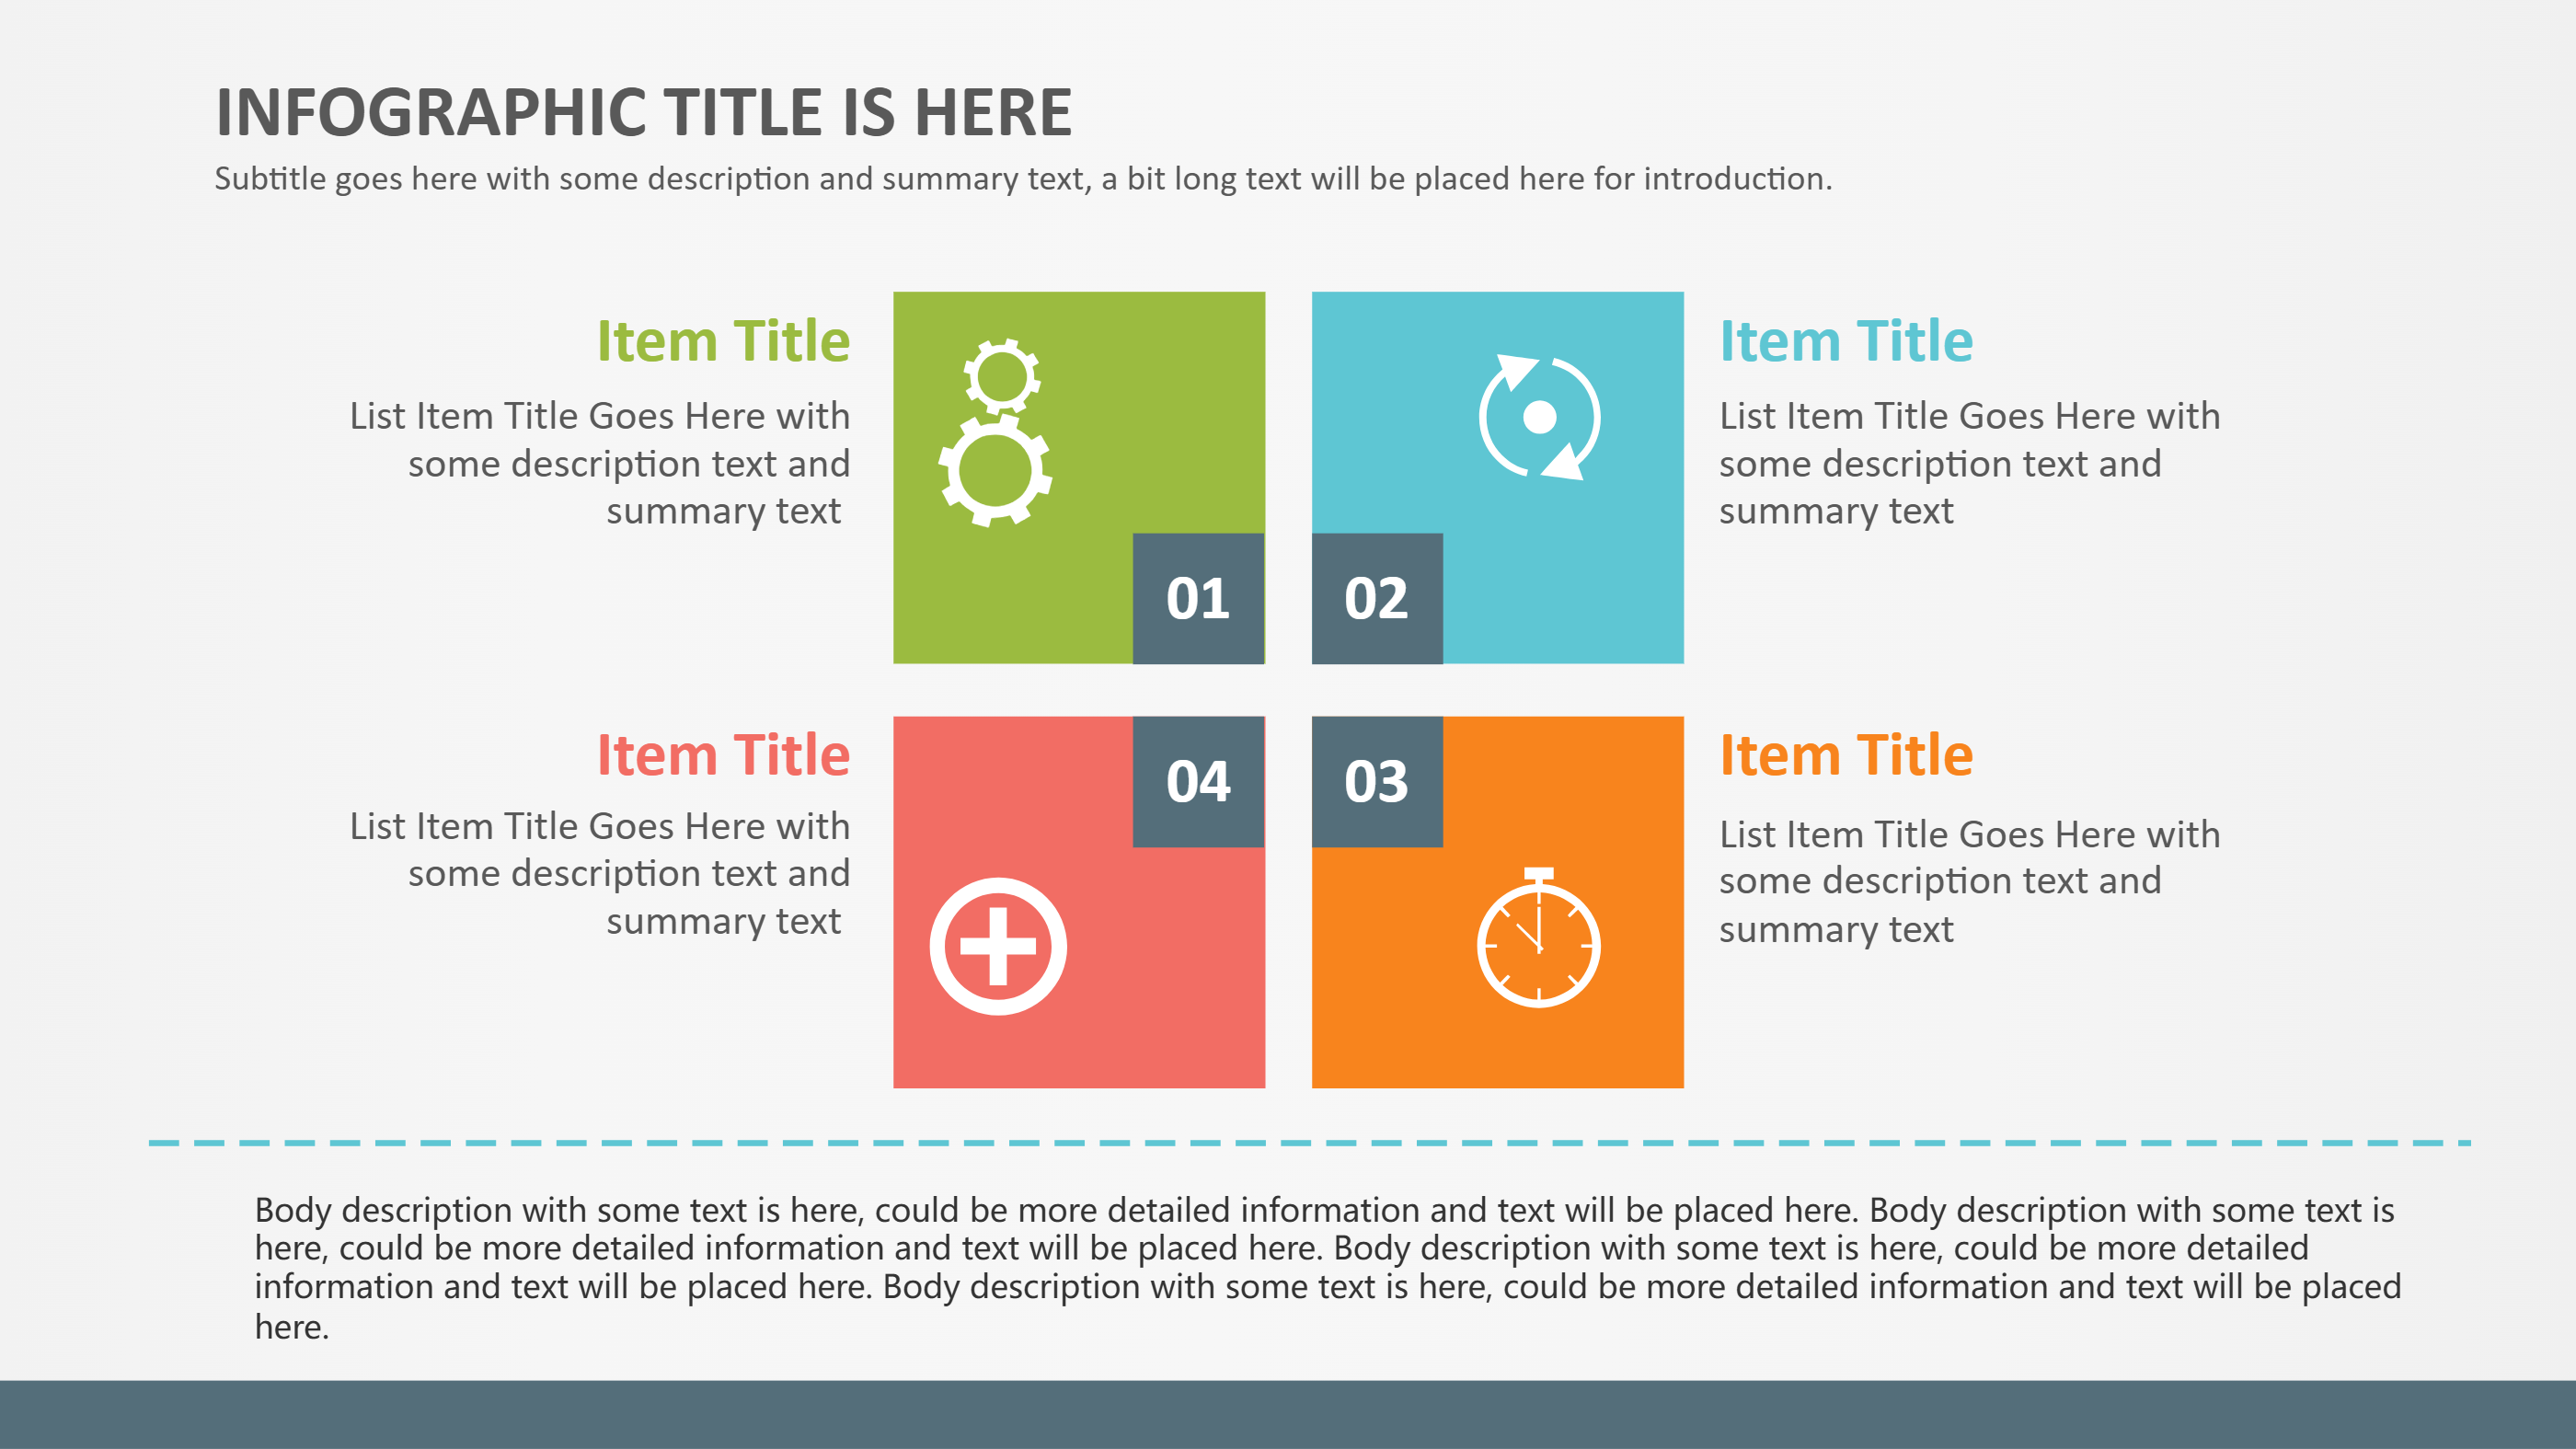
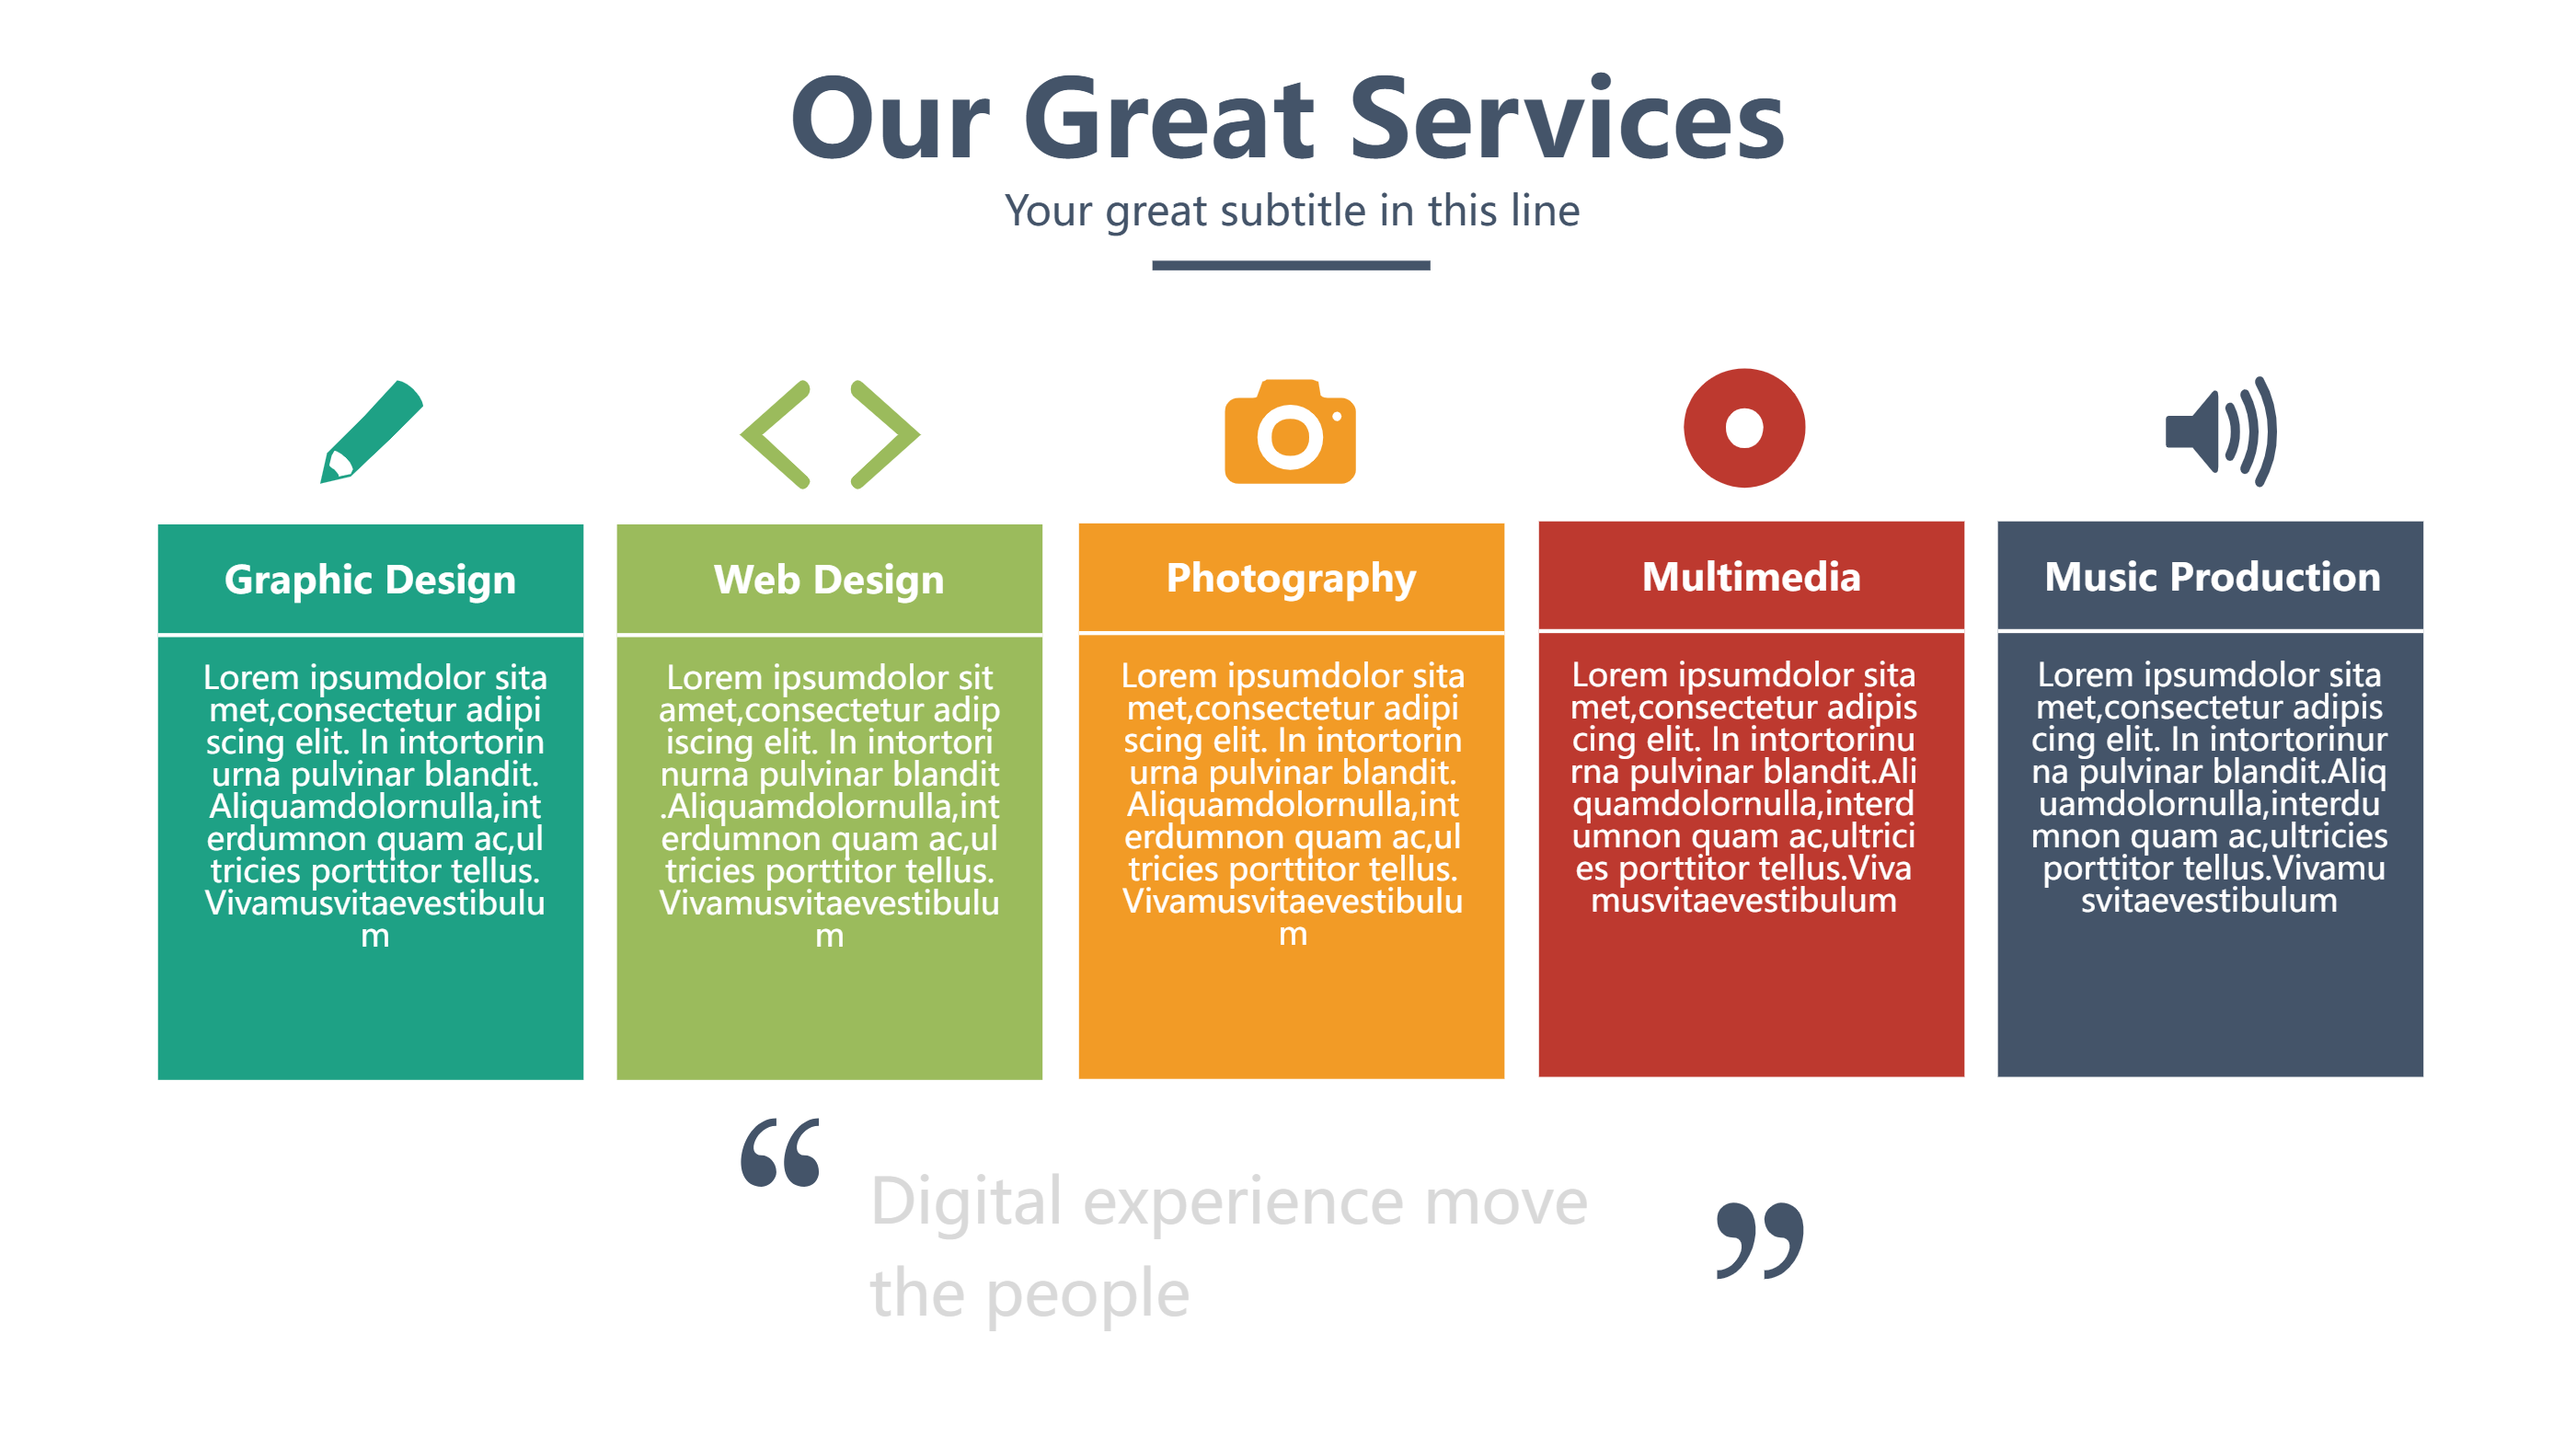
A Metabase dashboard templates infographic is a ready layout for showing key numbers and simple charts in one place. It helps you present data stories in a clean and friendly way. A Metabase dashboard template can include sections for totals, changes, and comparisons. It keeps the page balanced so the viewer can see the main points at a glance. This is useful for sharing results in a PPT or a report without crowding the page. The infographic style keeps labels short and clear.
When to Use Metabase Dashboard Templates Infographic
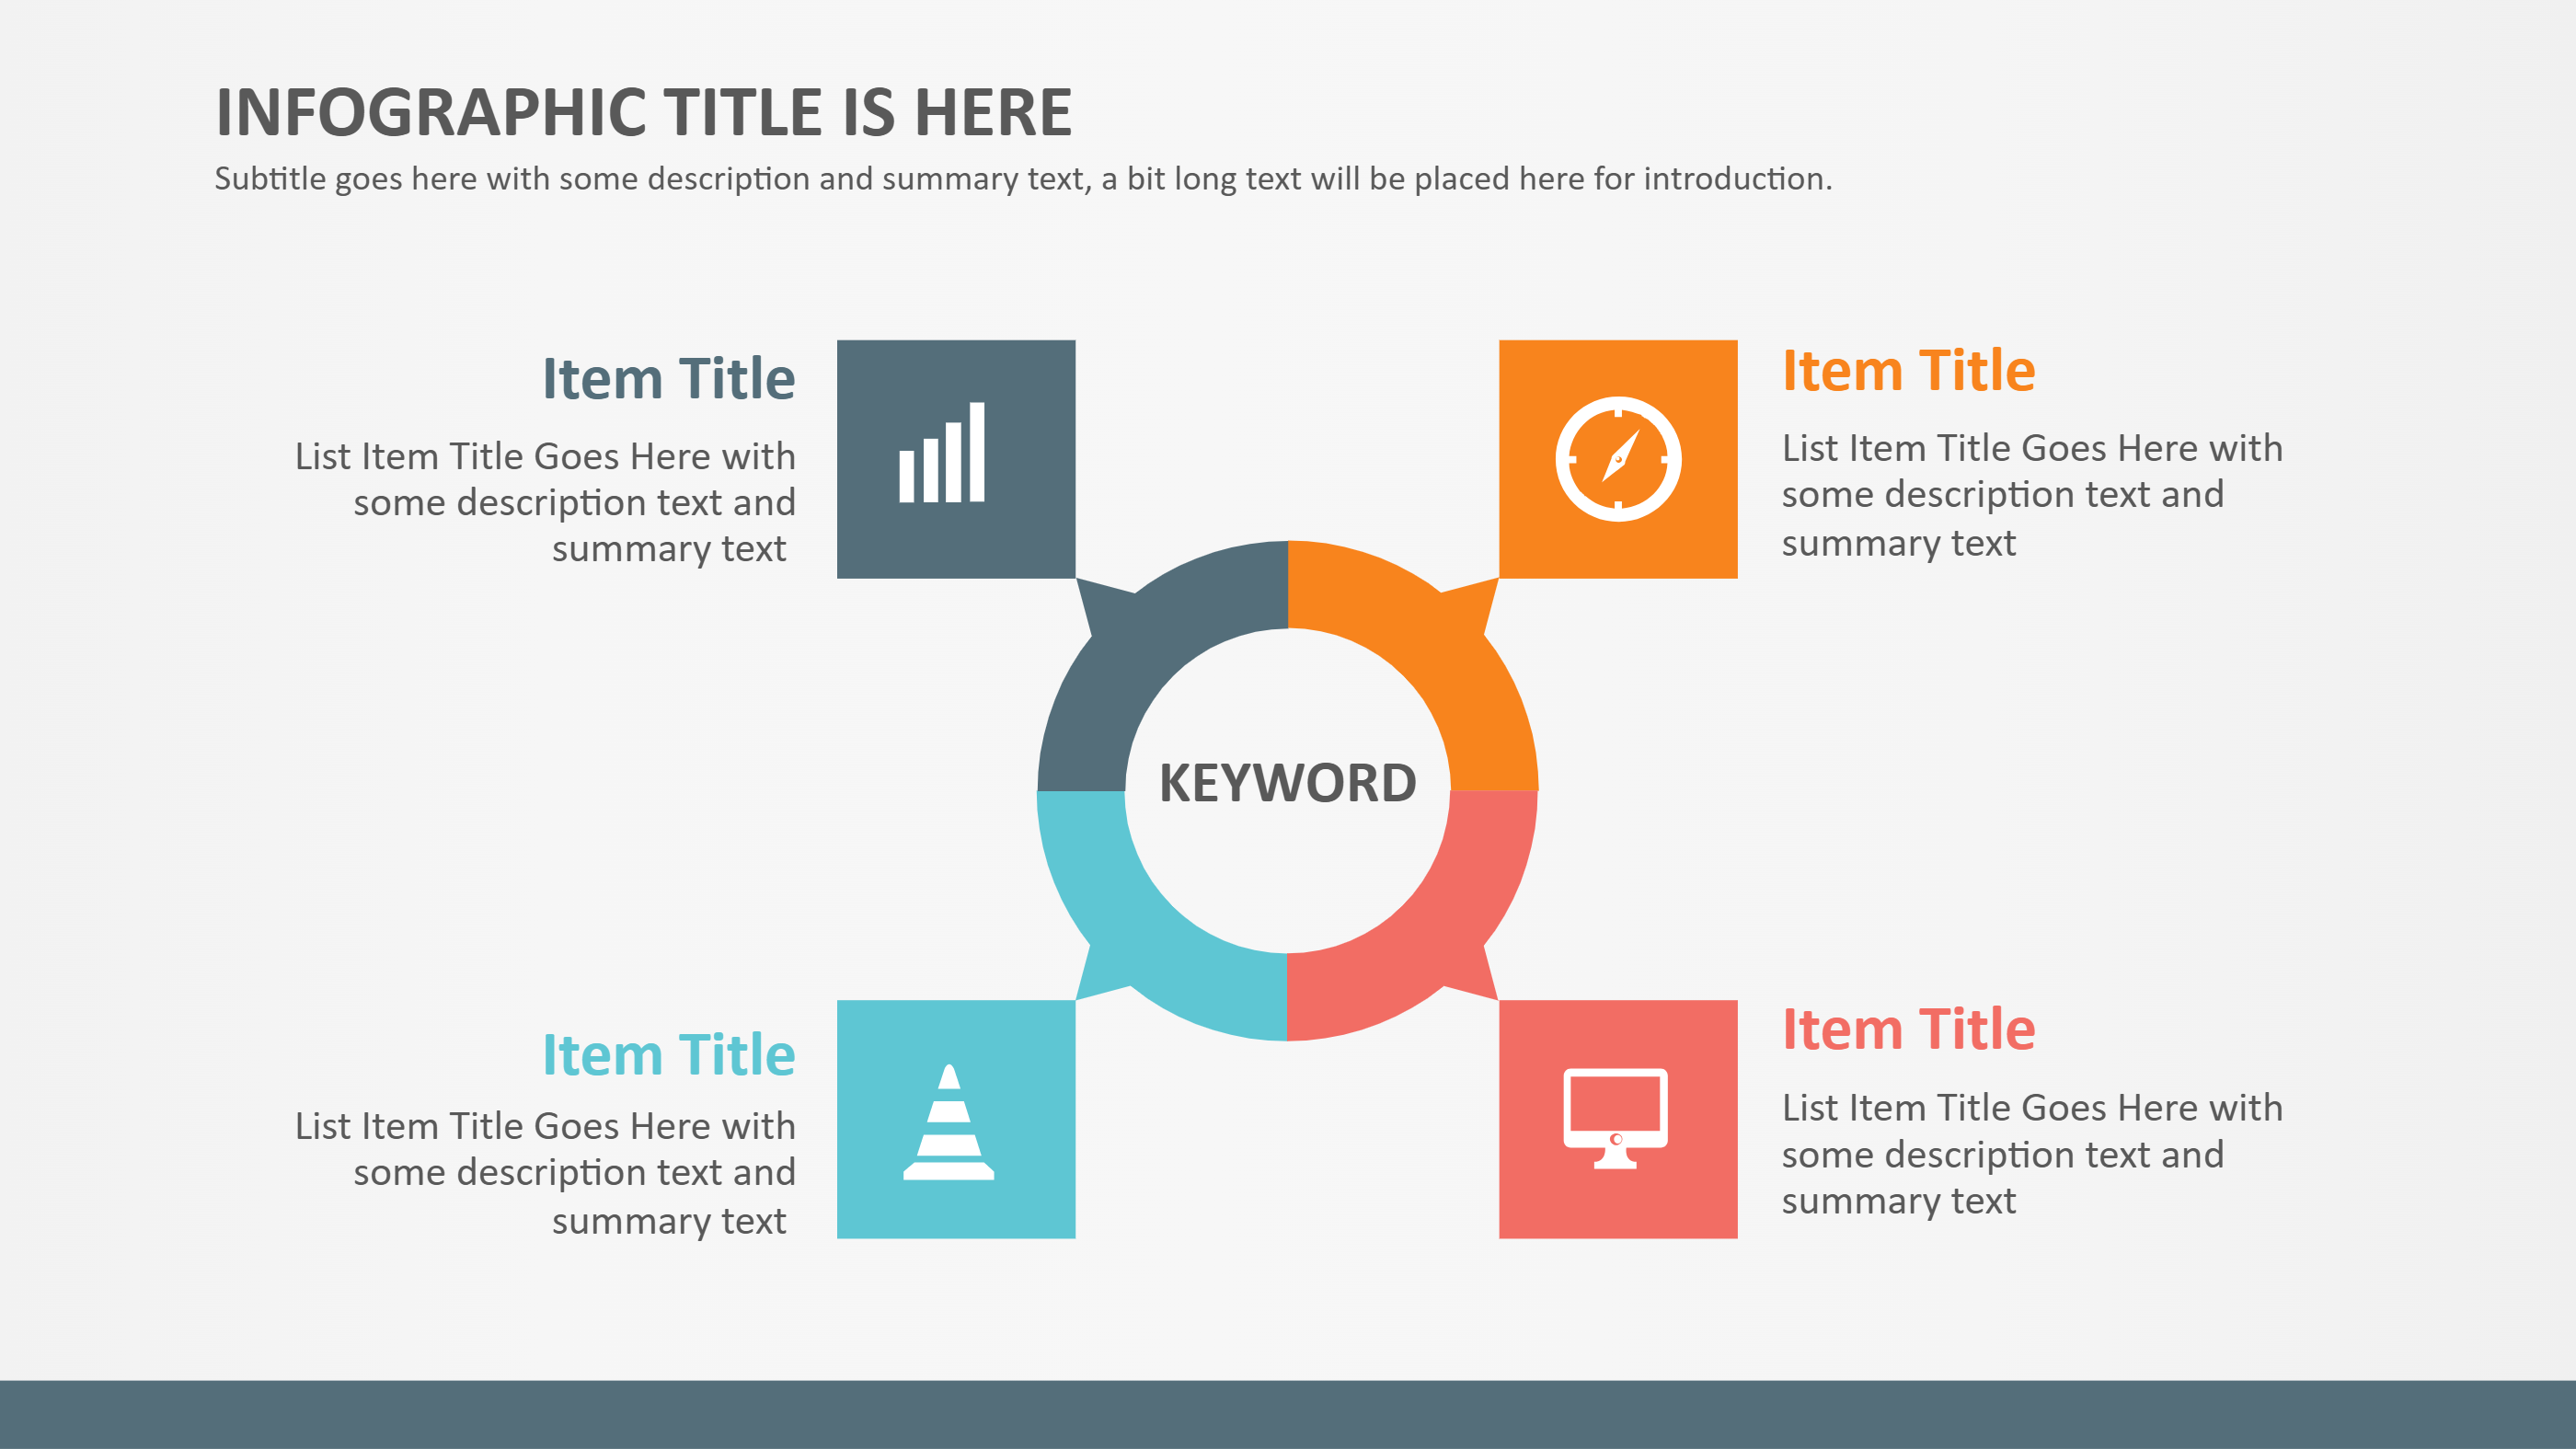
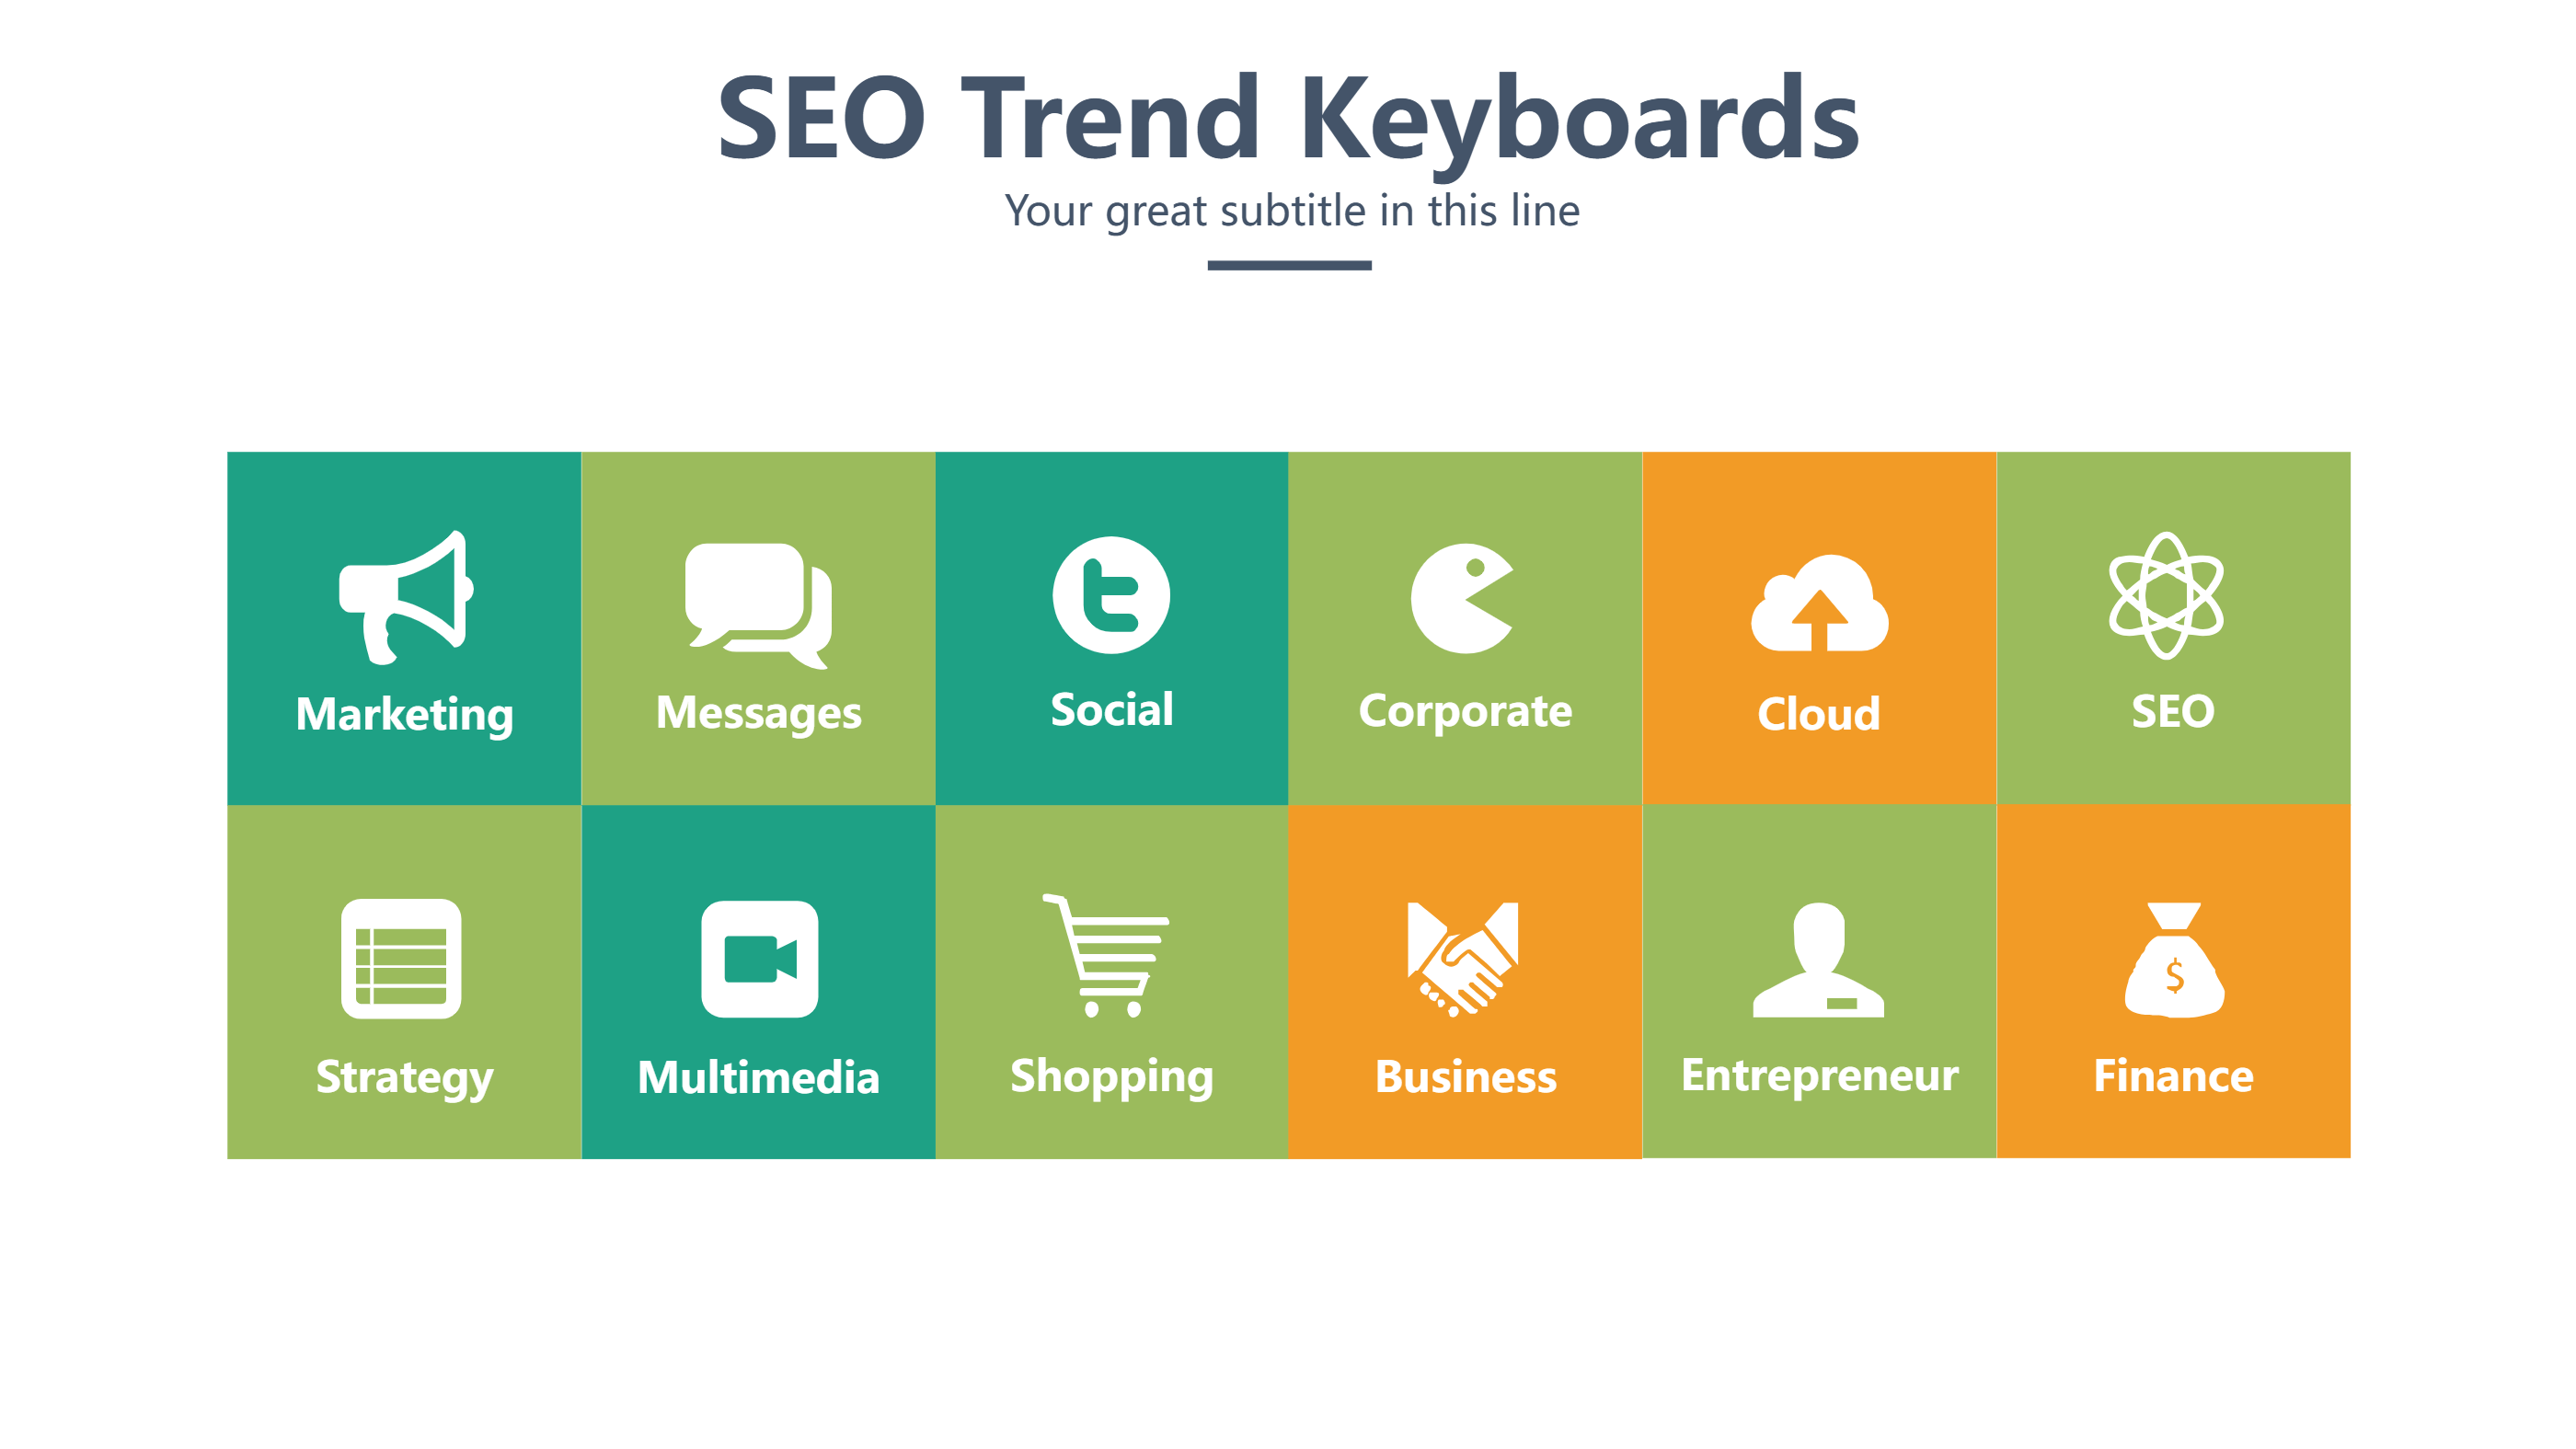
Use Metabase dashboard templates when you need a quick view of business progress, campaign results, or project health. It is helpful for weekly updates, team meetings, or a simple status report. It also works for school data, survey results, or community reports. The template lets you present numbers without long explanations, so the audience can focus on the message. It is also useful when you want to keep charts consistent across many slides.
How to Use the Metabase Dashboard Templates Infographic
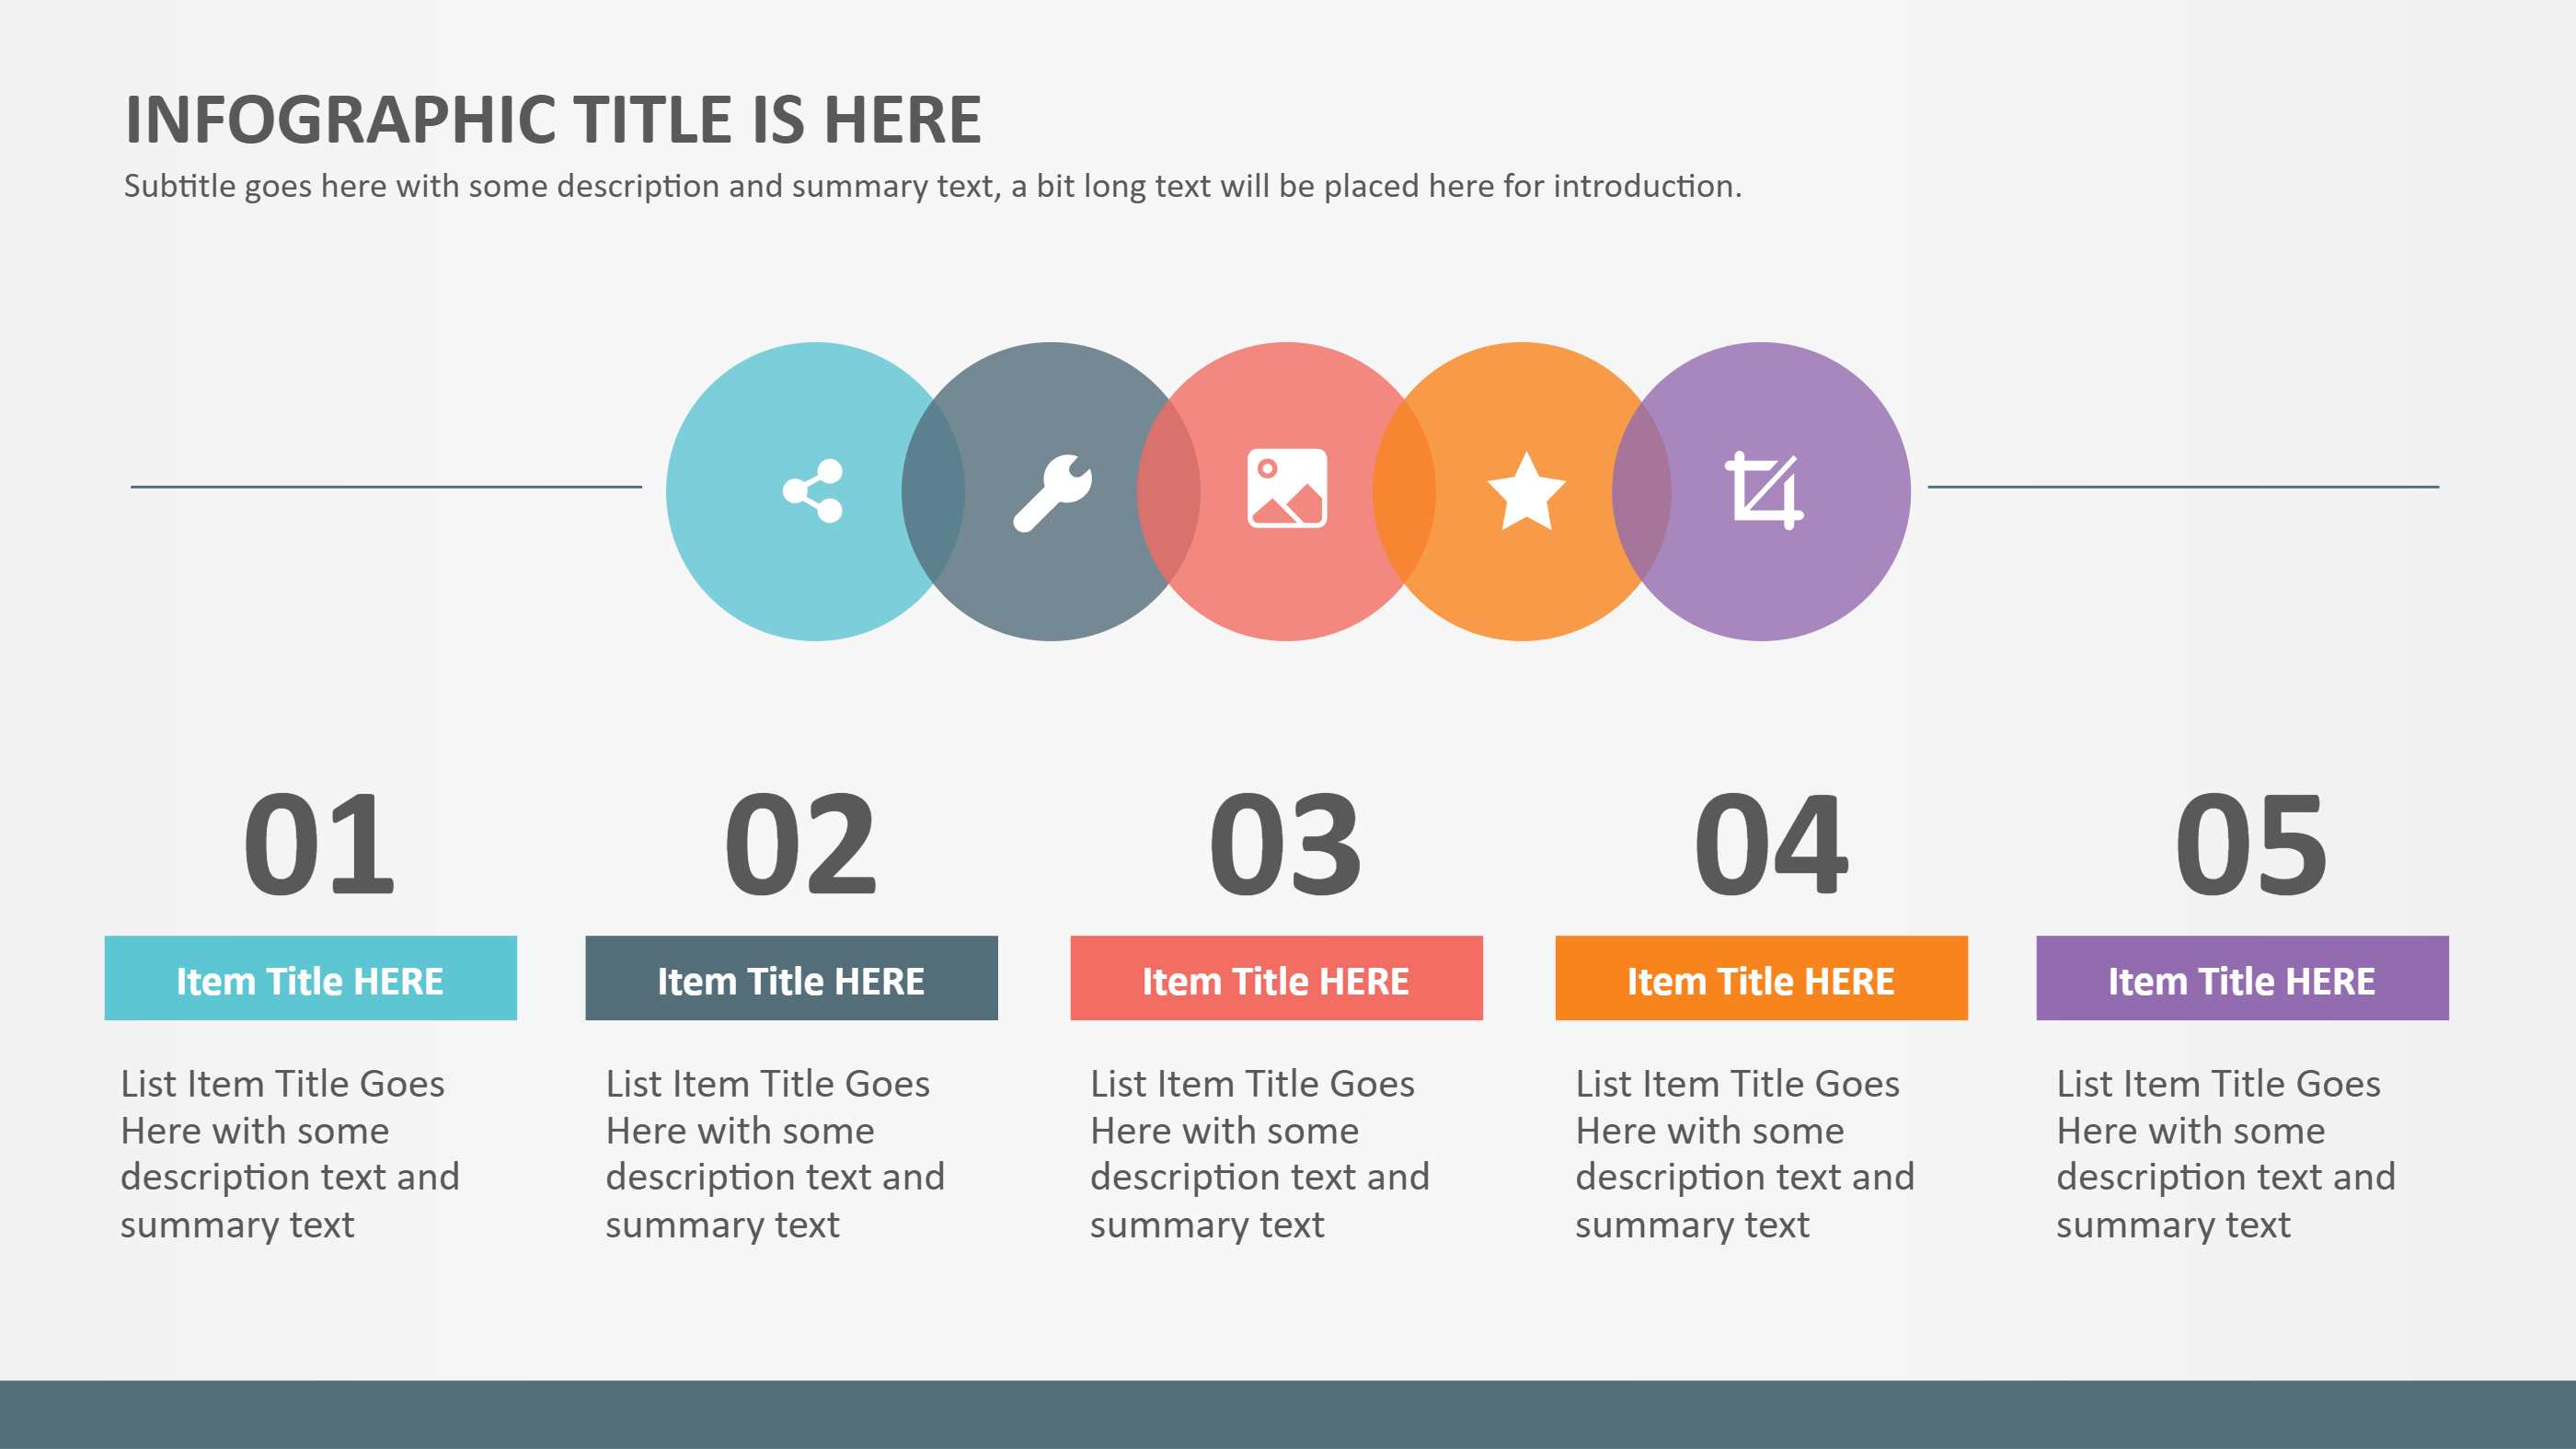
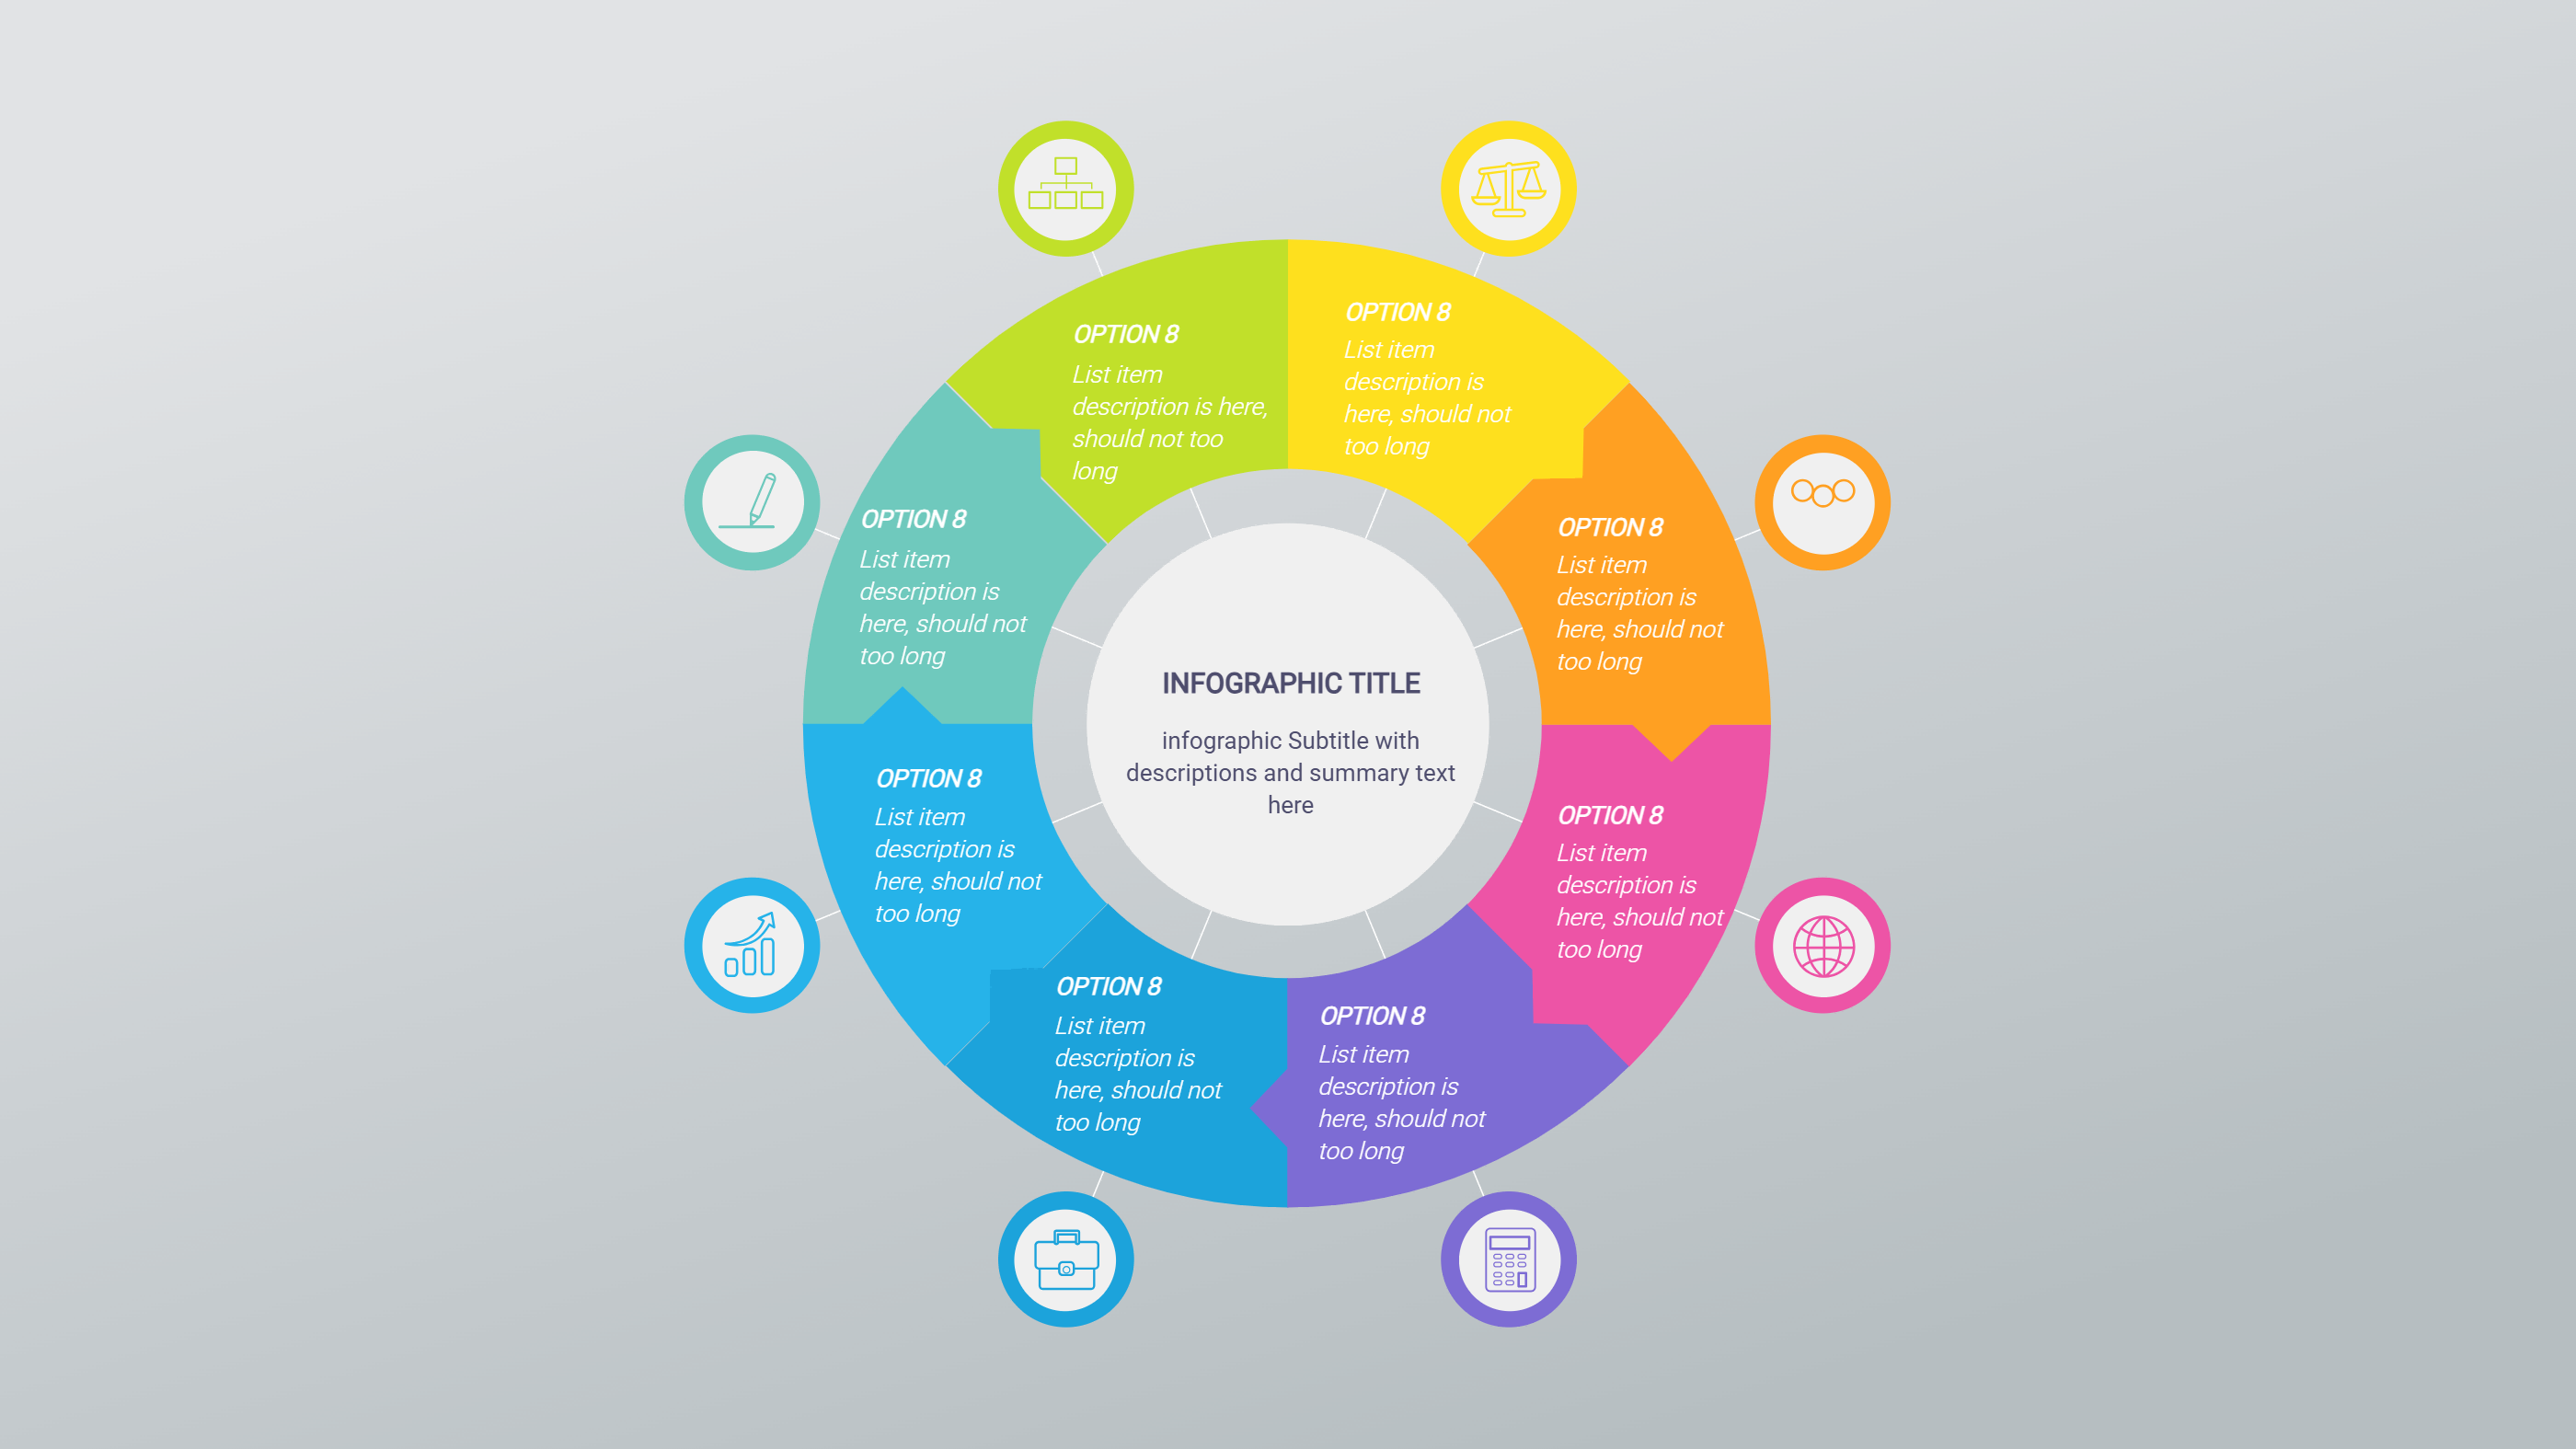
On the home page, open the AI creation tool and choose a Metabase dashboard template that matches your topic. Enter a prompt that lists the main numbers and the labels you want to show. The tool fills the infographic with clean chart areas and short captions. You can update colors, change chart order, and rename labels to match your data. Keep the text short so the Metabase dashboard templates remain easy to scan.
Download Assets for the Metabase Dashboard Templates
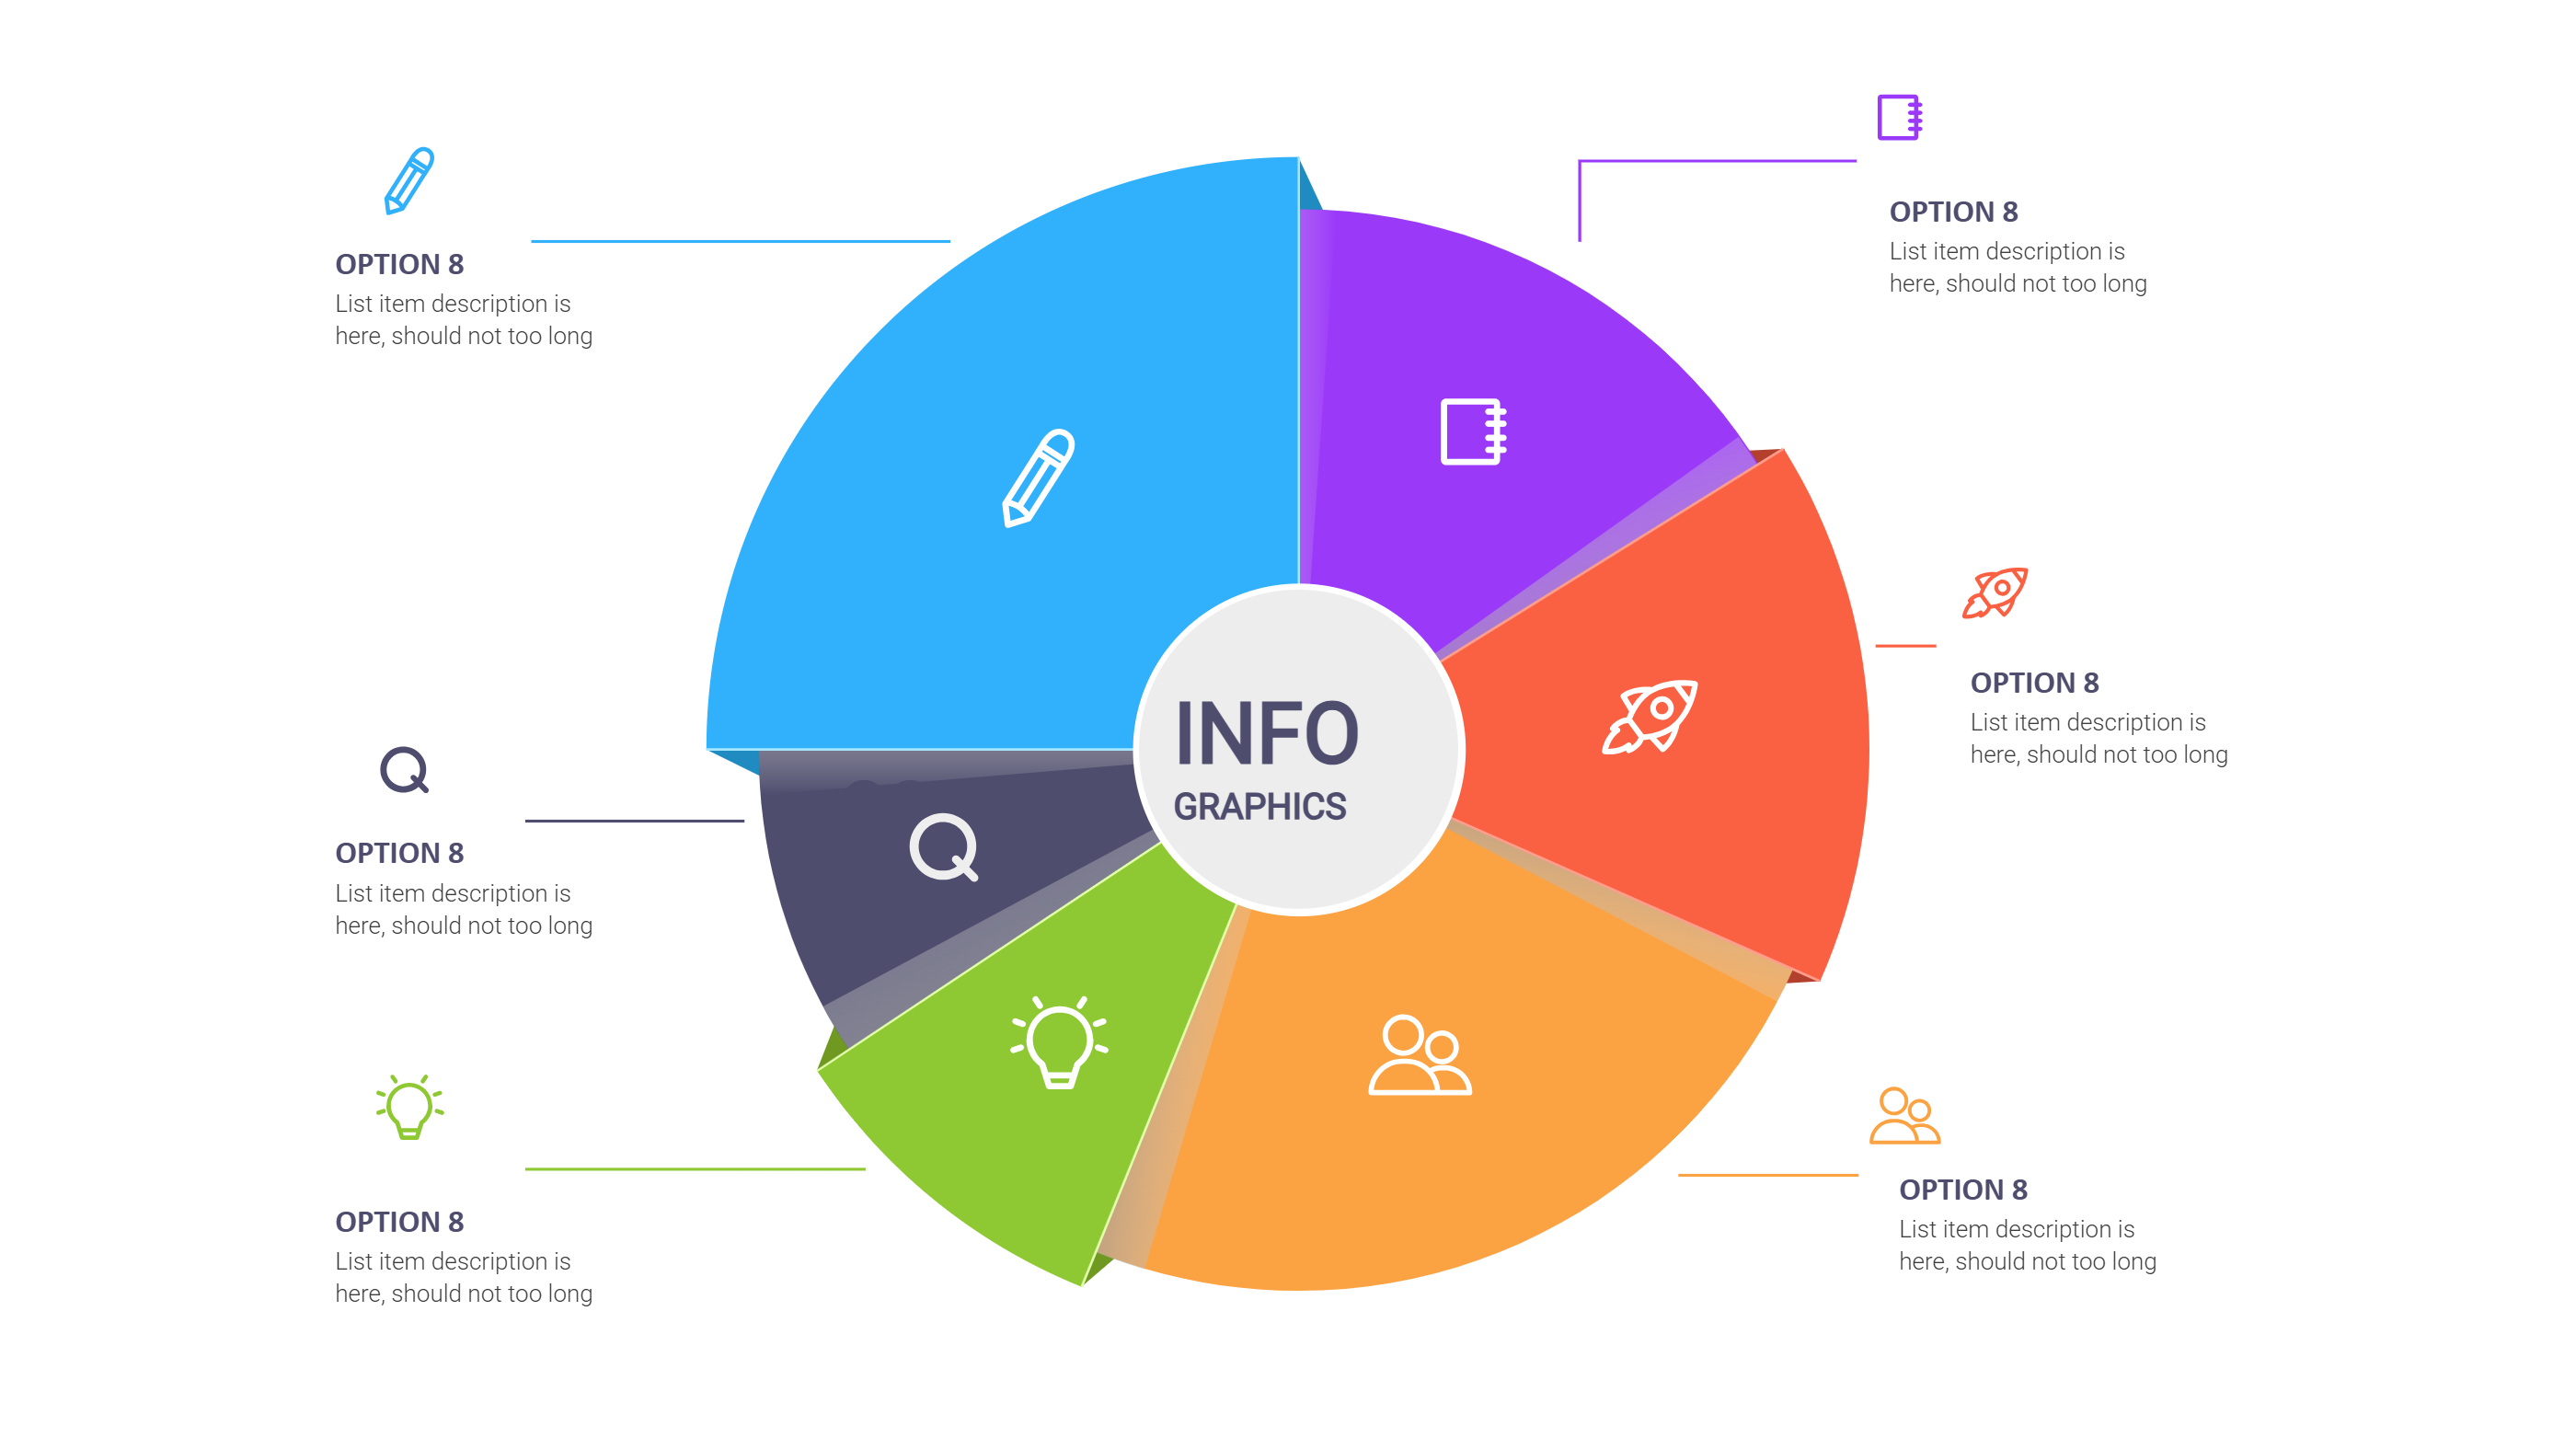
Click the download button and an online editor will open. Use the save button to choose PPT, PNG, or SVG. You can edit the chart colors, replace icons, or adjust spacing before saving. Export to PPT for a presentation or save as PNG for a quick share. This makes the Metabase dashboard templates flexible for many teams.
FAQ
Q: Do I need to connect Metabase to use the template?
A: No, the template is a visual layout you can fill with your data.
Q: Can I show both totals and trends?
A: Yes, the layout has room for key numbers and simple trends.
Q: Are the Metabase dashboard templates good for weekly updates?
A: Yes, they are ideal for short status summaries.
Q: Can I change the chart colors to match a brand?
A: Yes, colors and labels are editable.
Q: Can I save the dashboard as a PPT slide?
A: Yes, PPT is available in the download options.
Q: Is the template suitable for a small report?
A: Yes, it keeps information clear on a single page.