Template for Statistical Analysis with Clear Numeric Highlights
What is Template for Statistical Analysis Infographic
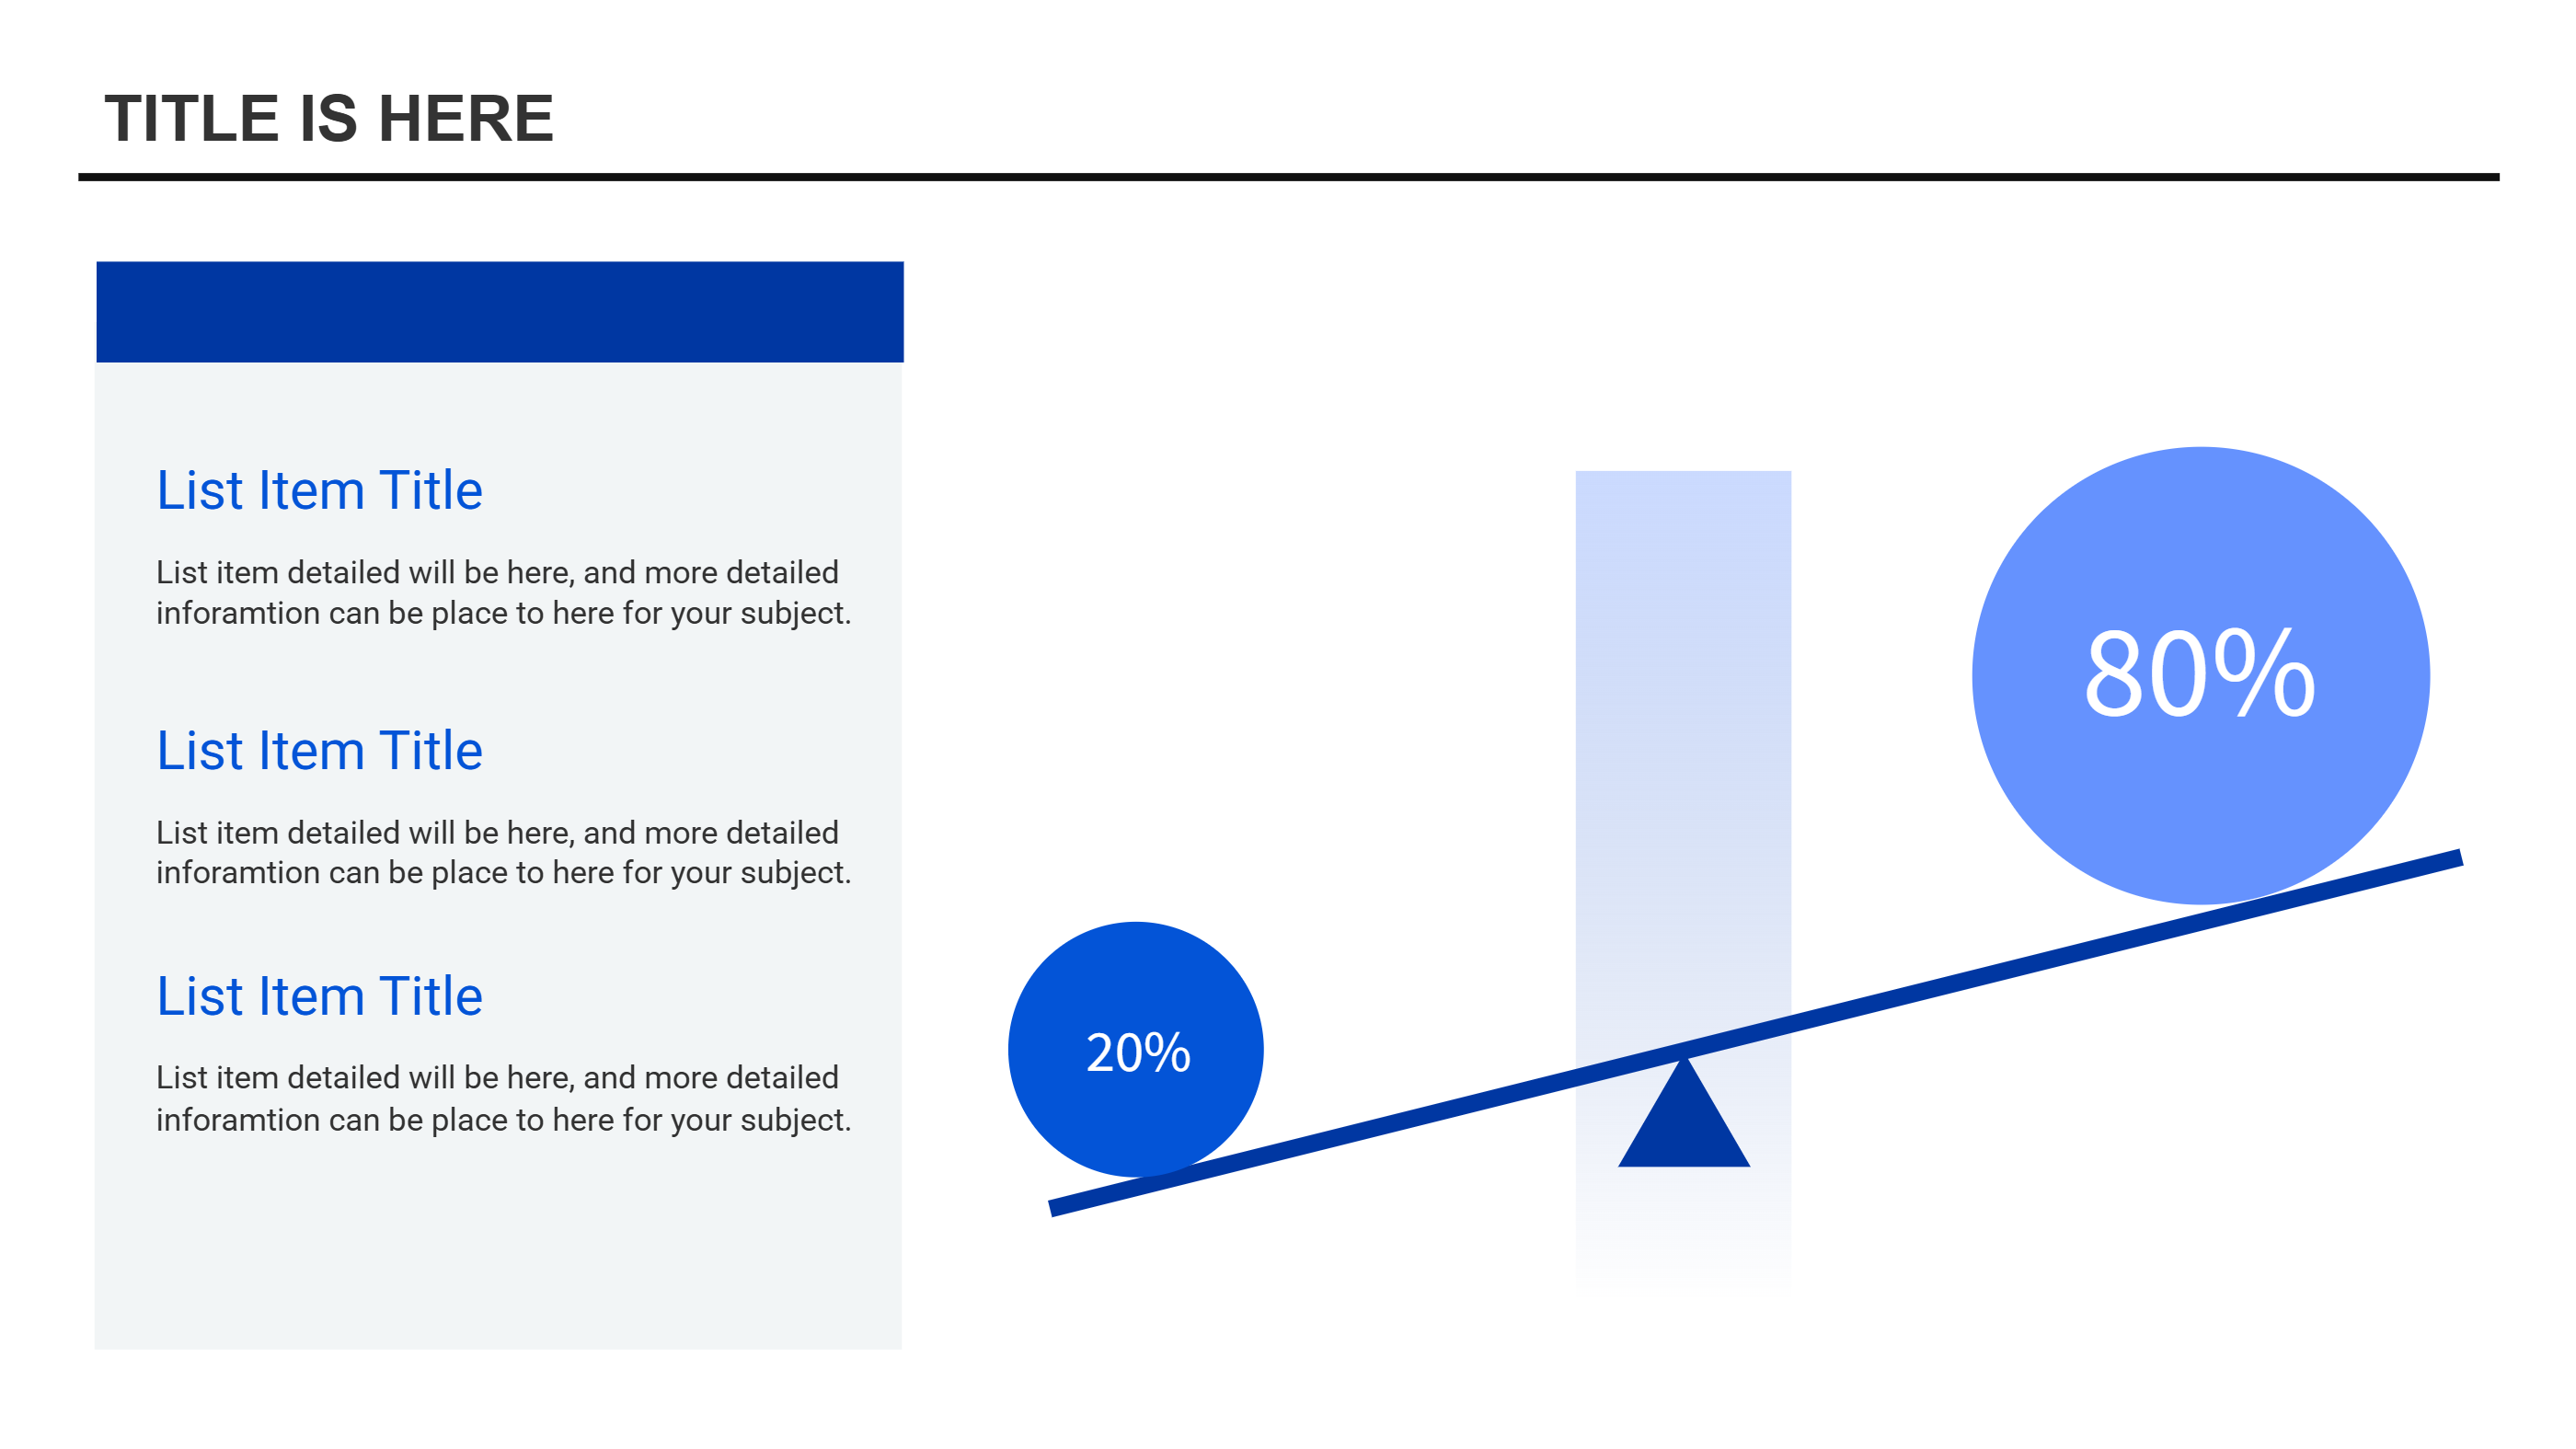
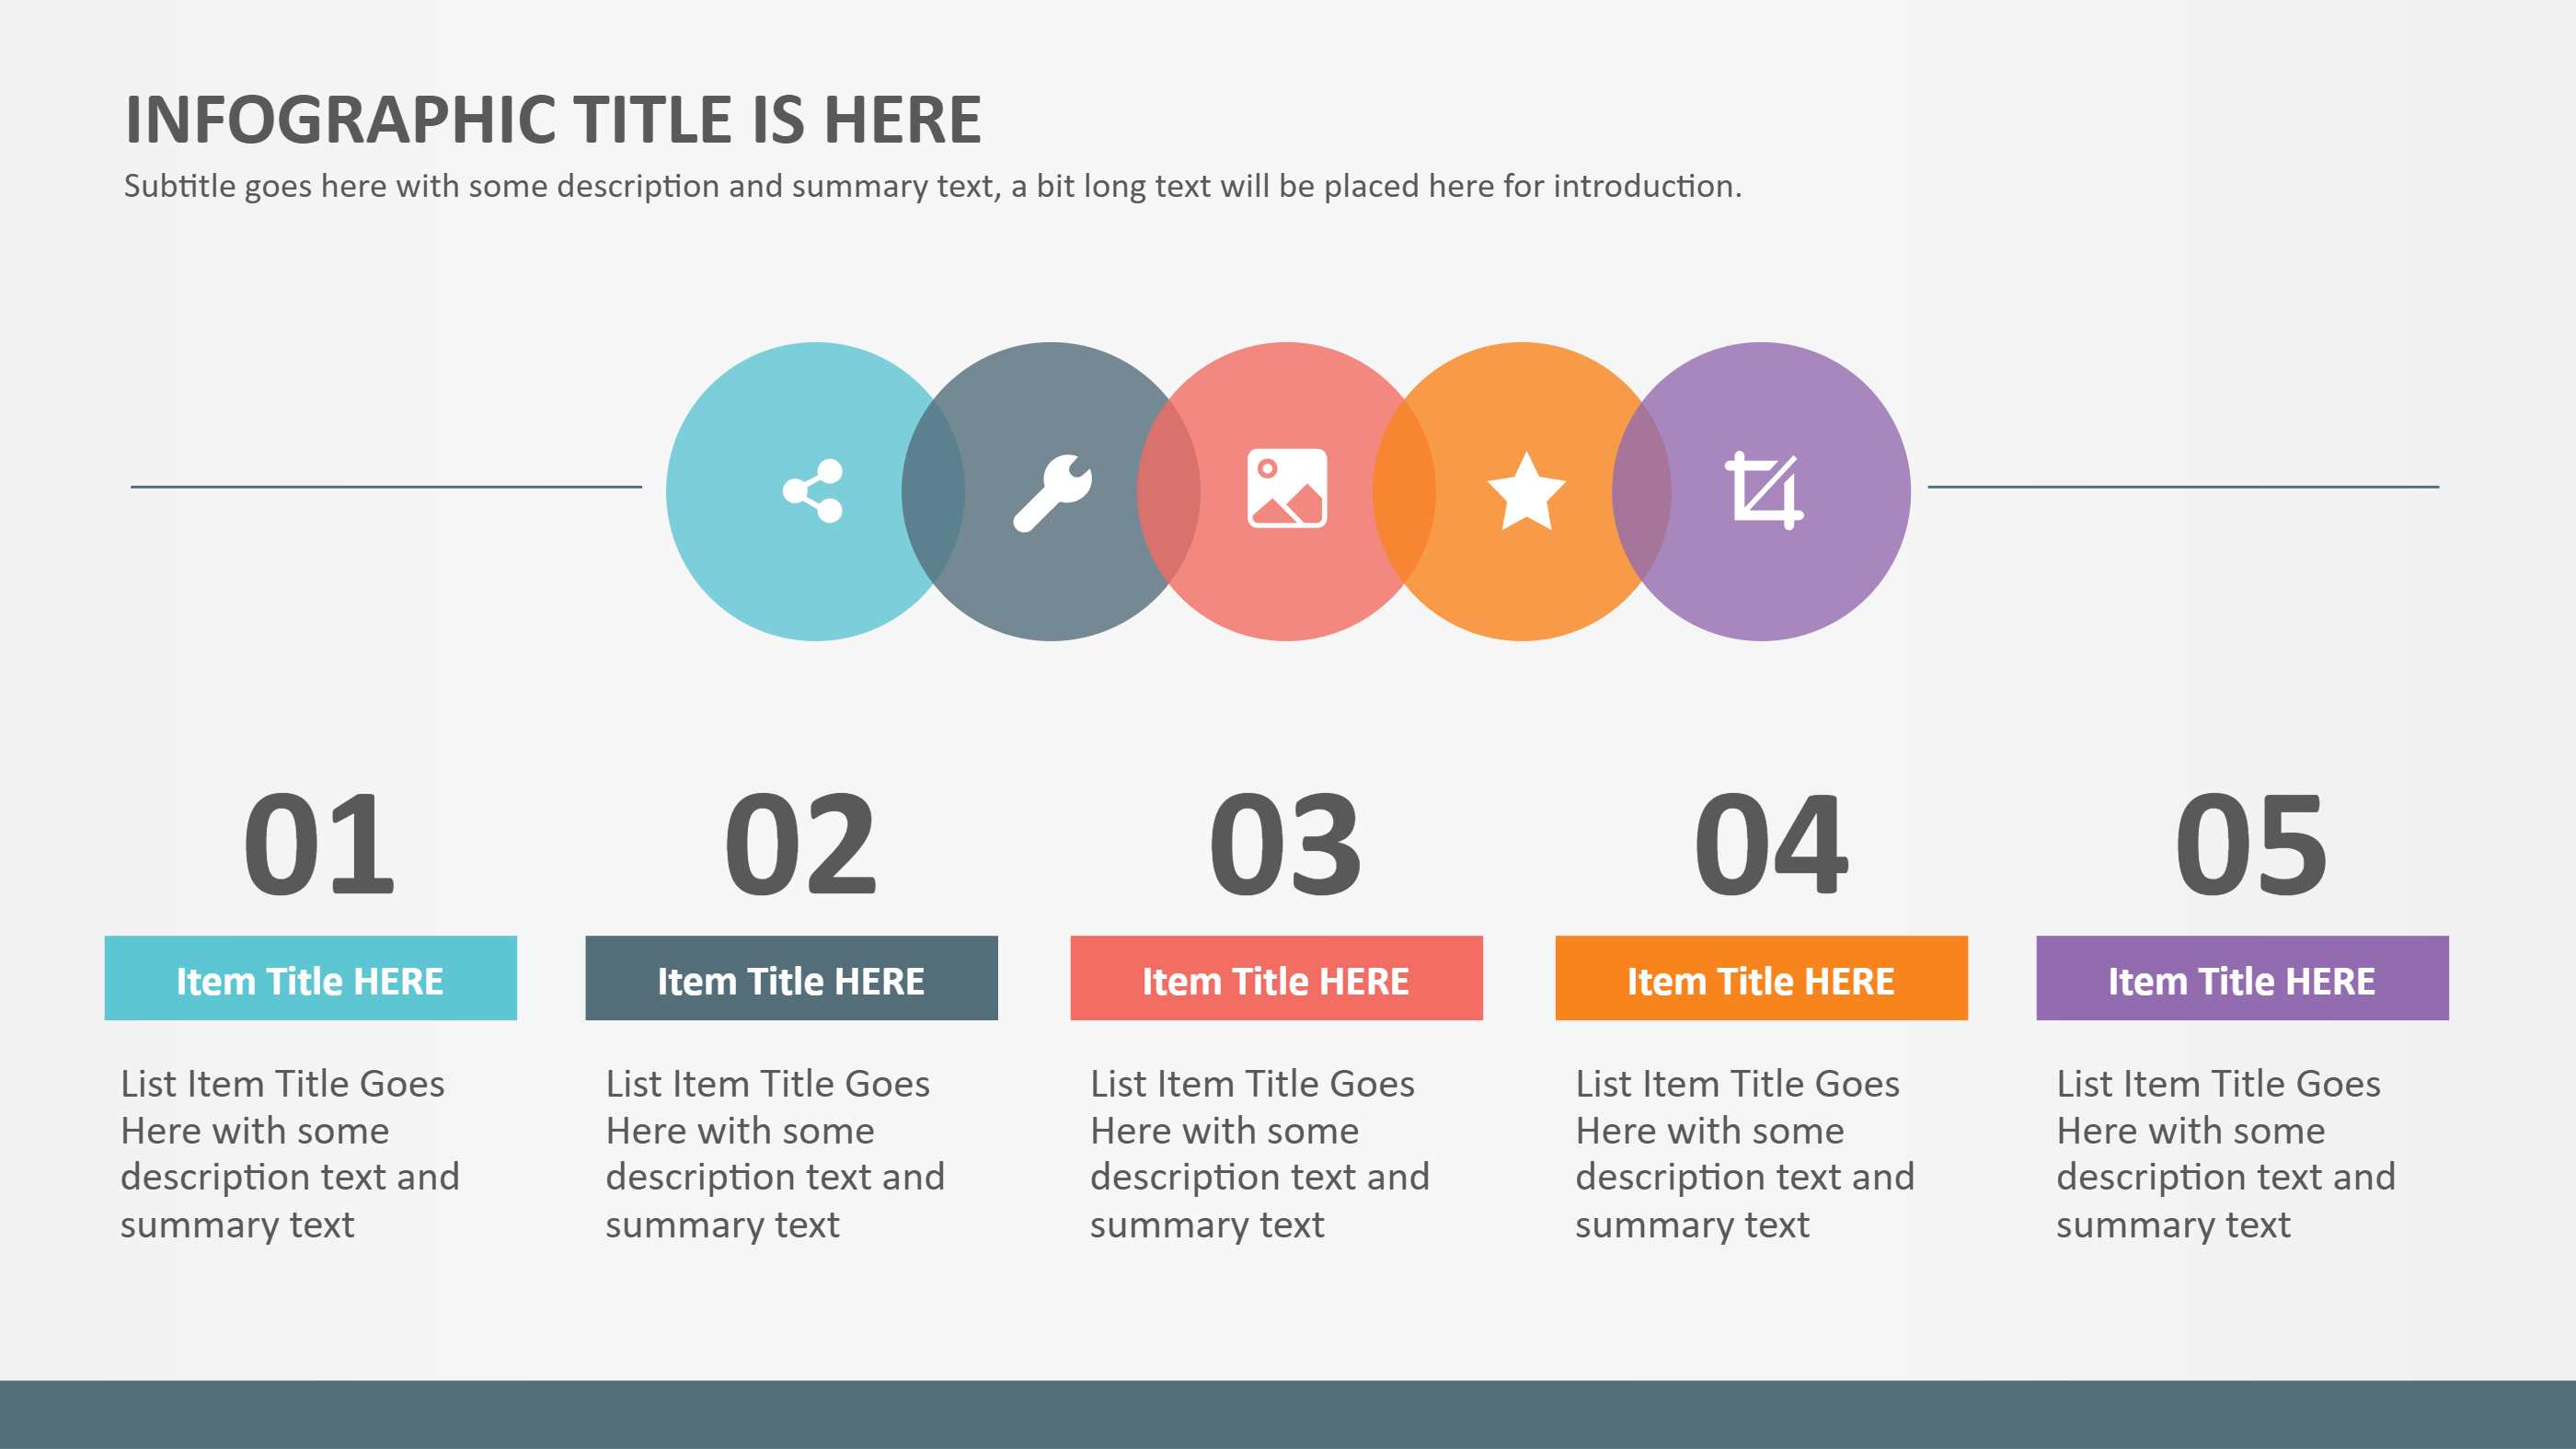
A template for statistical analysis infographic is a clear layout that shows numbers in a simple view. It uses short labels, small charts, and key values to explain results. The layout keeps the focus on the main numbers and avoids long text. It helps people understand the story behind the data quickly.
This template works for class reports, small business reviews, and survey summaries. It can show totals, averages, and simple comparisons. It can also include a short note about what the numbers mean. The design stays clean so the data is easy to read.
When to Use Numeric Branch Diagram Infographic
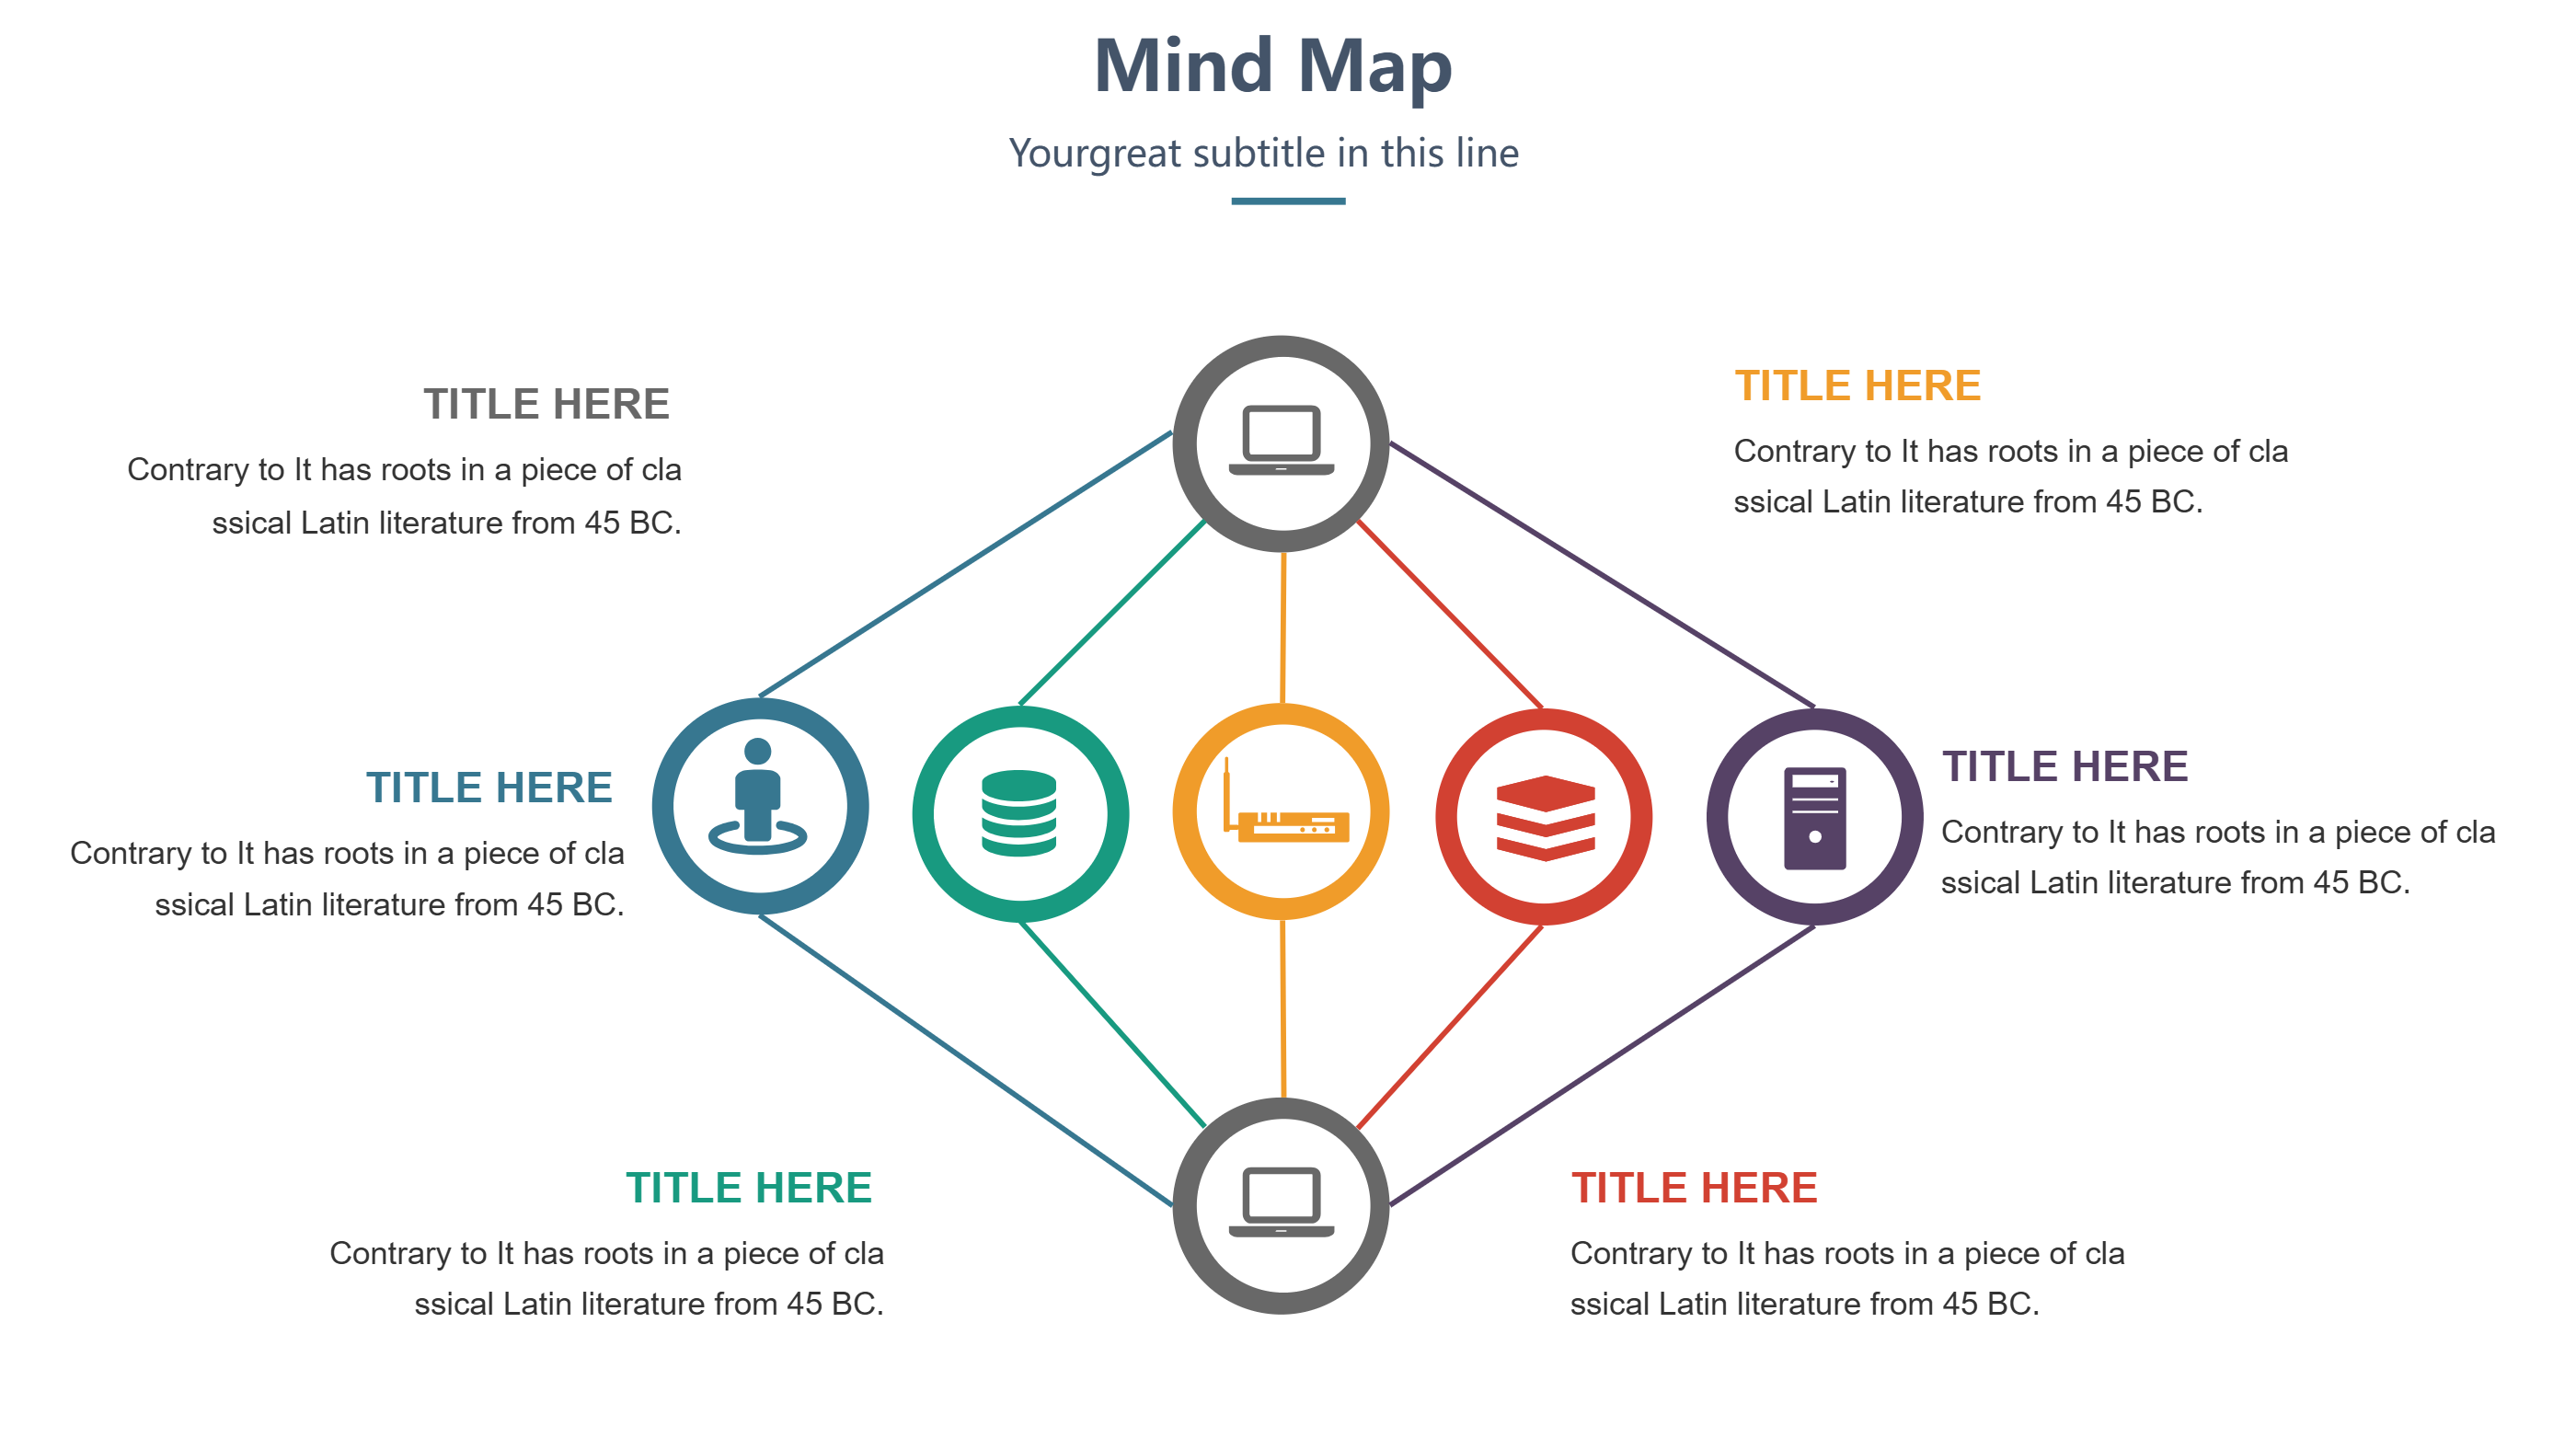
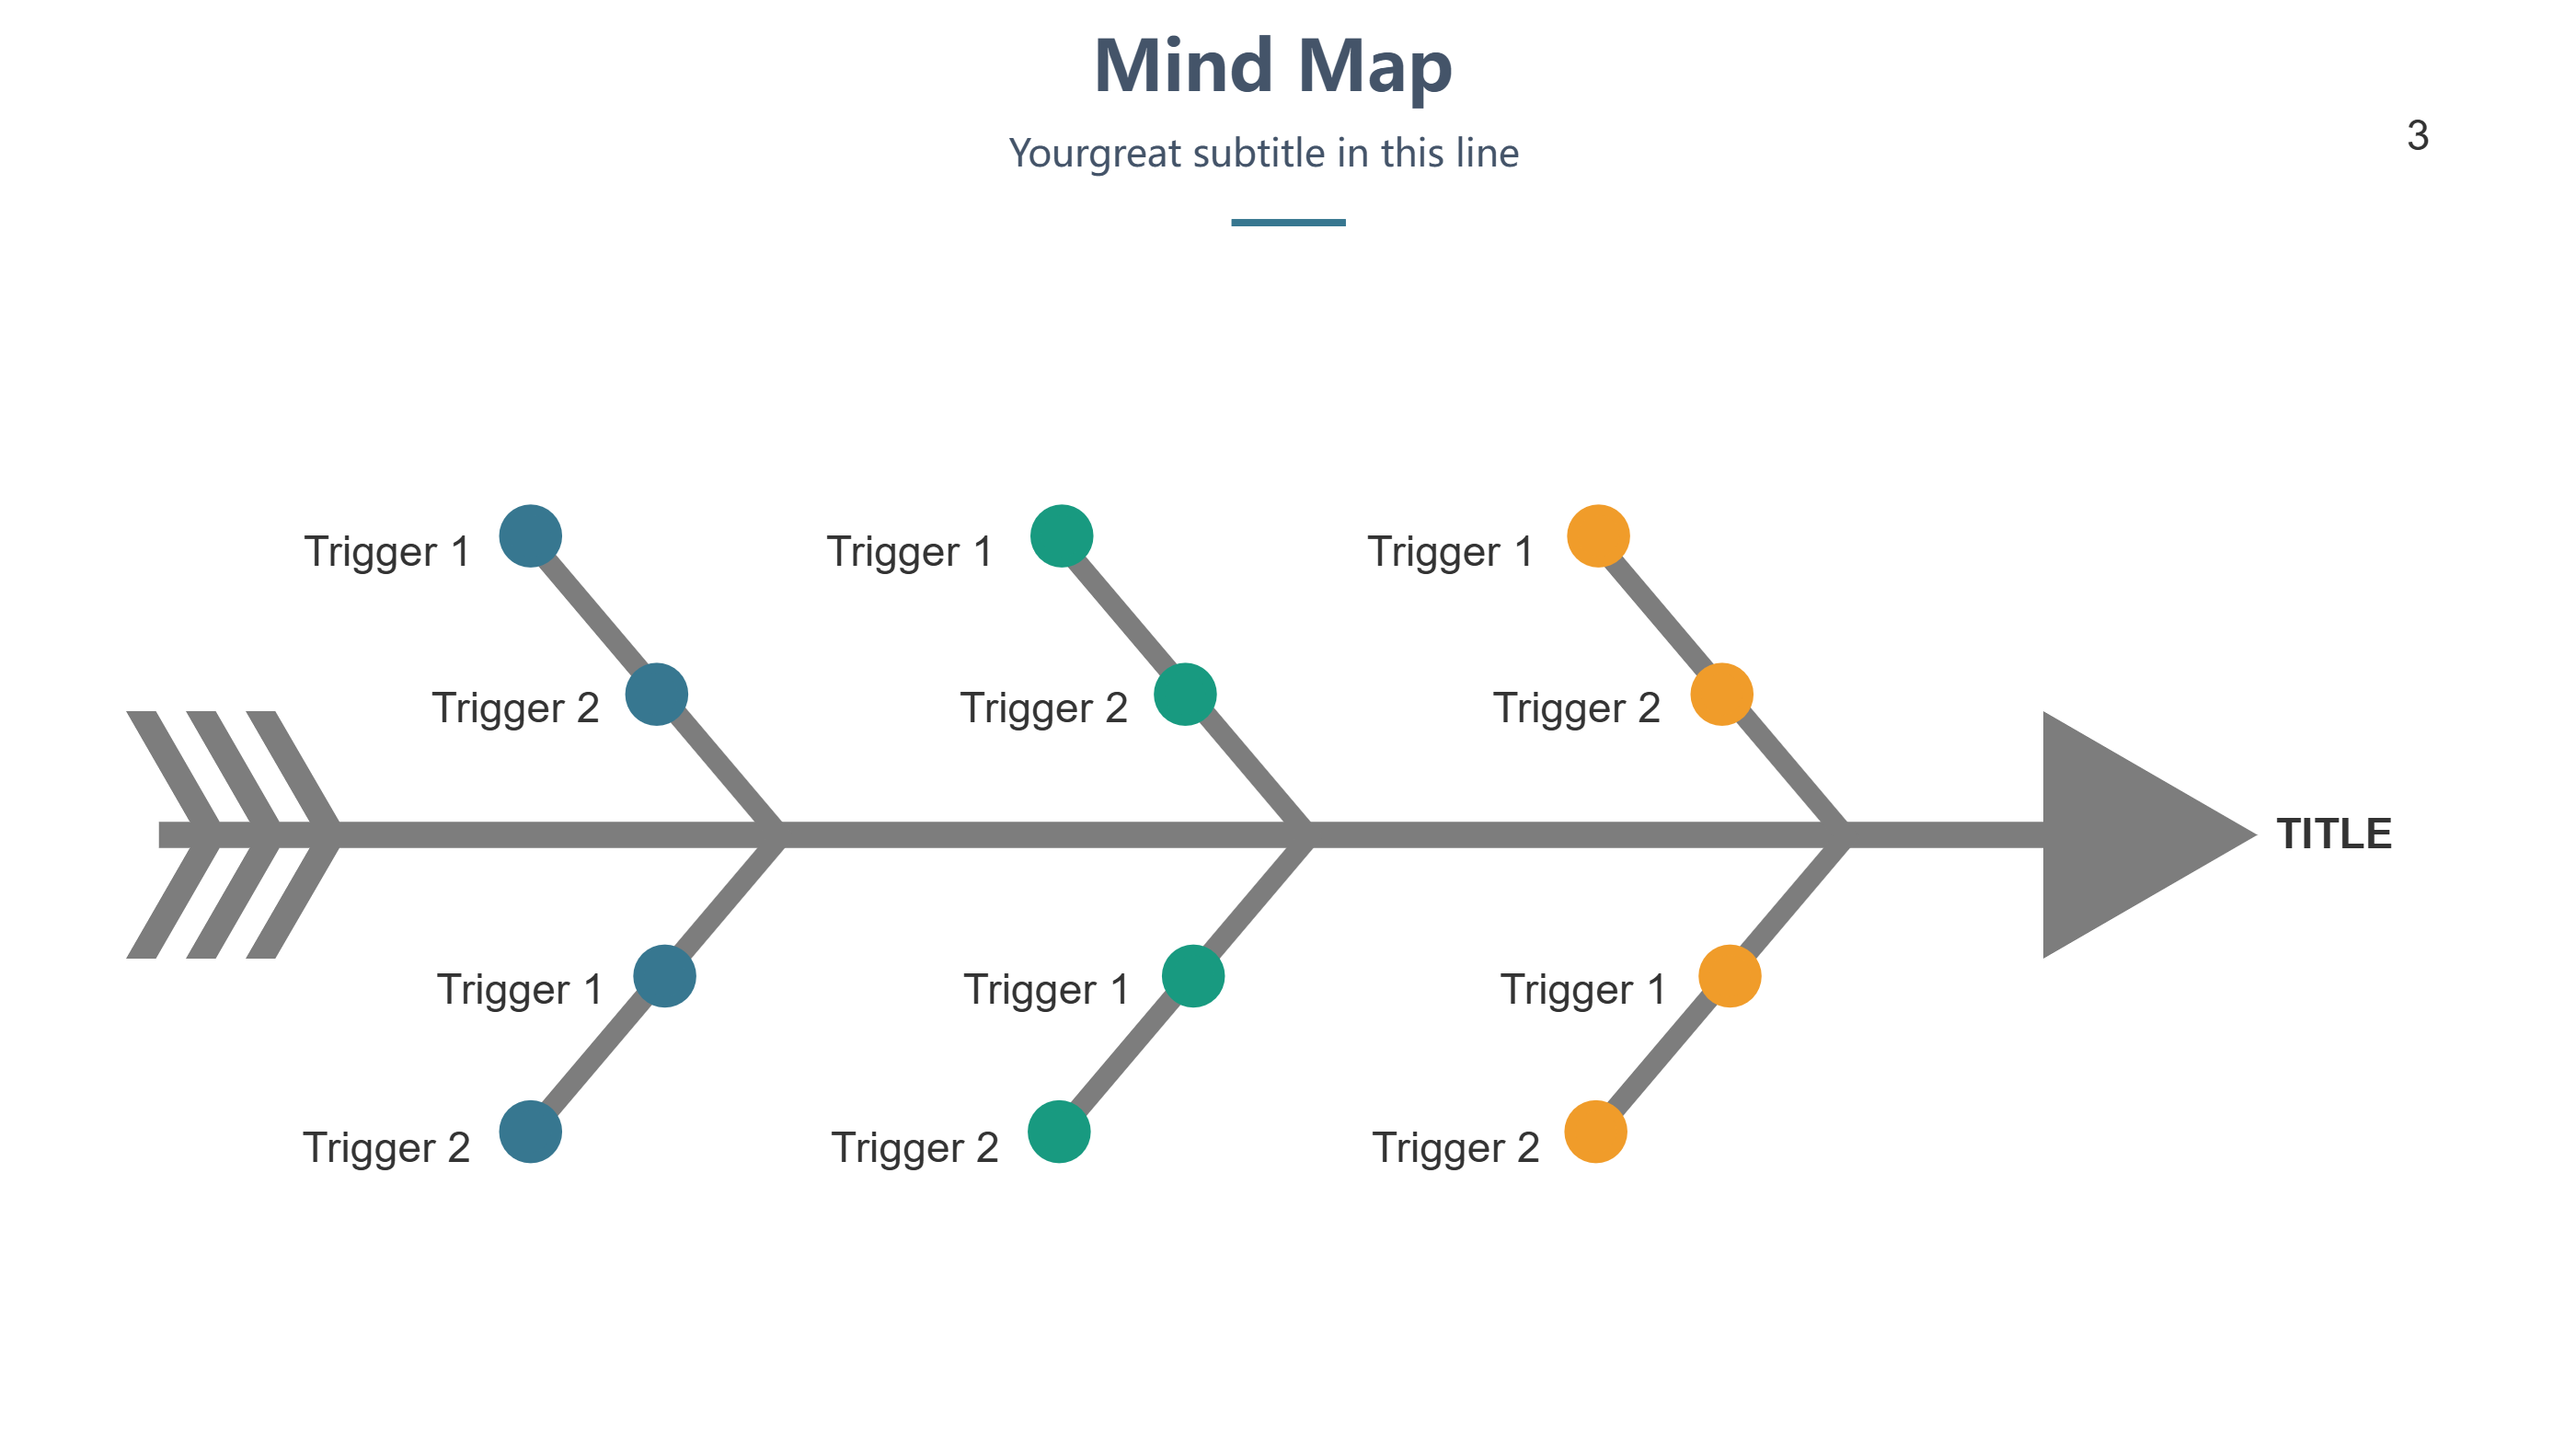
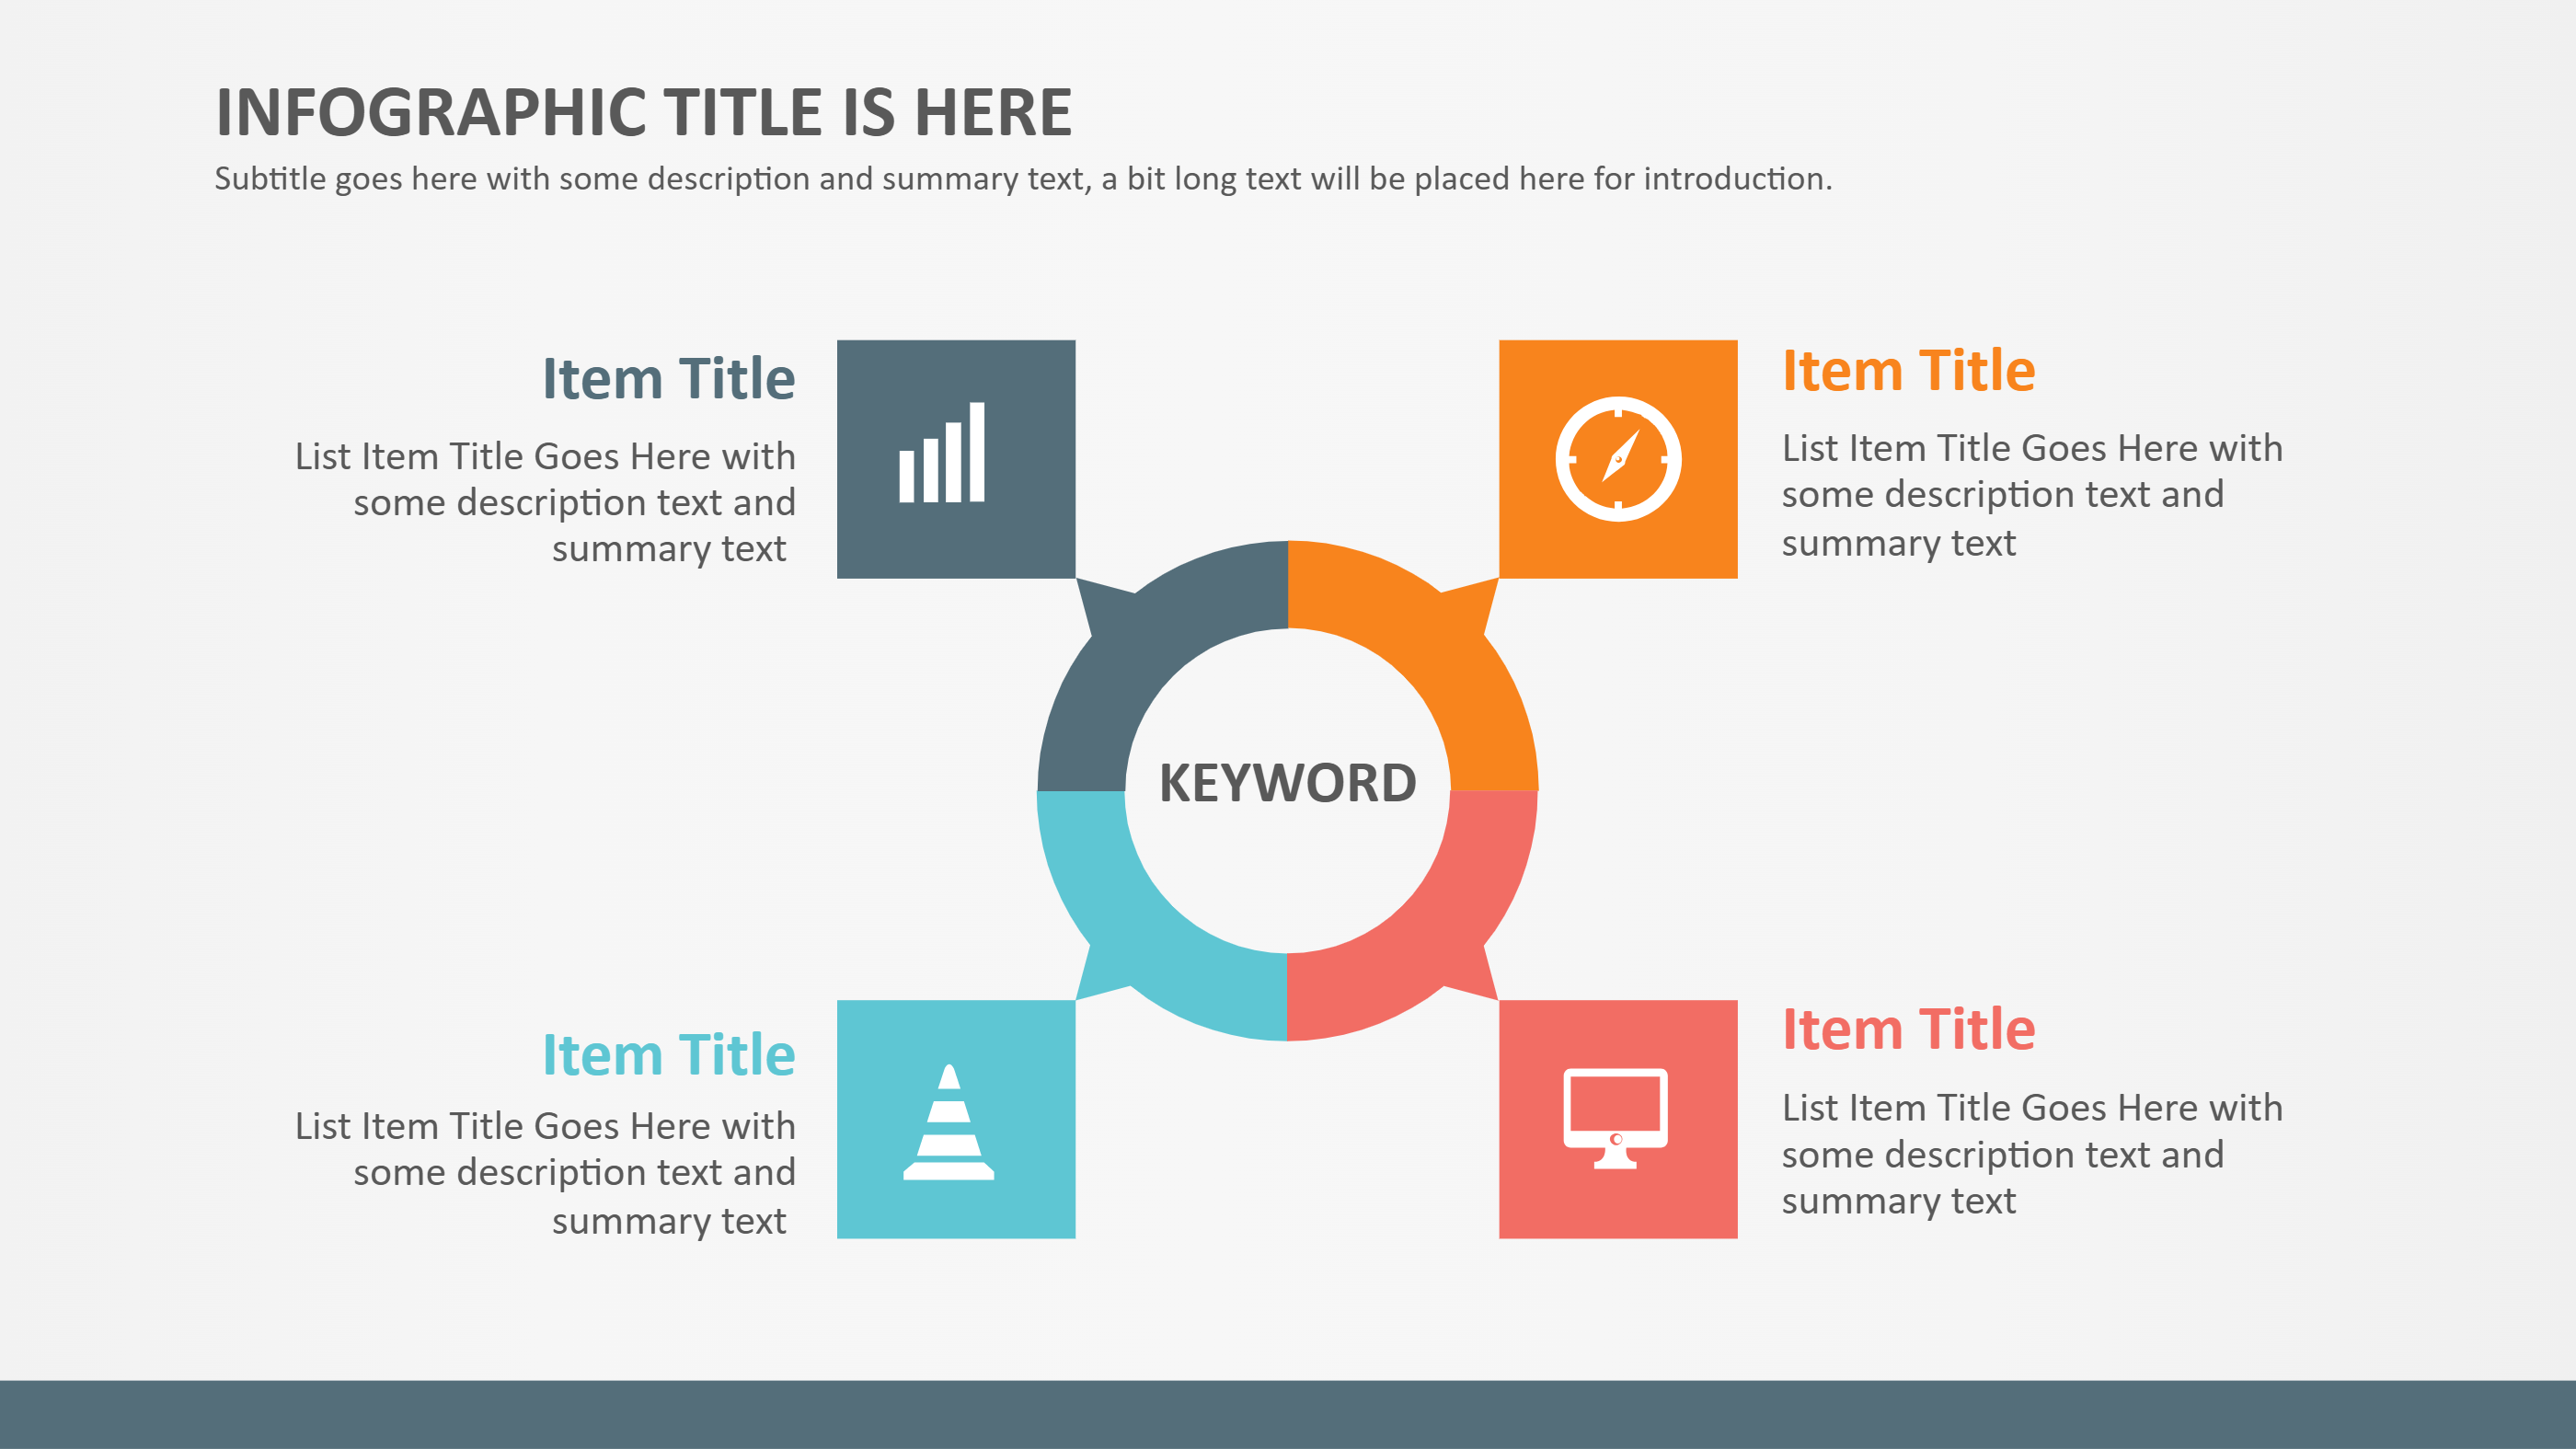
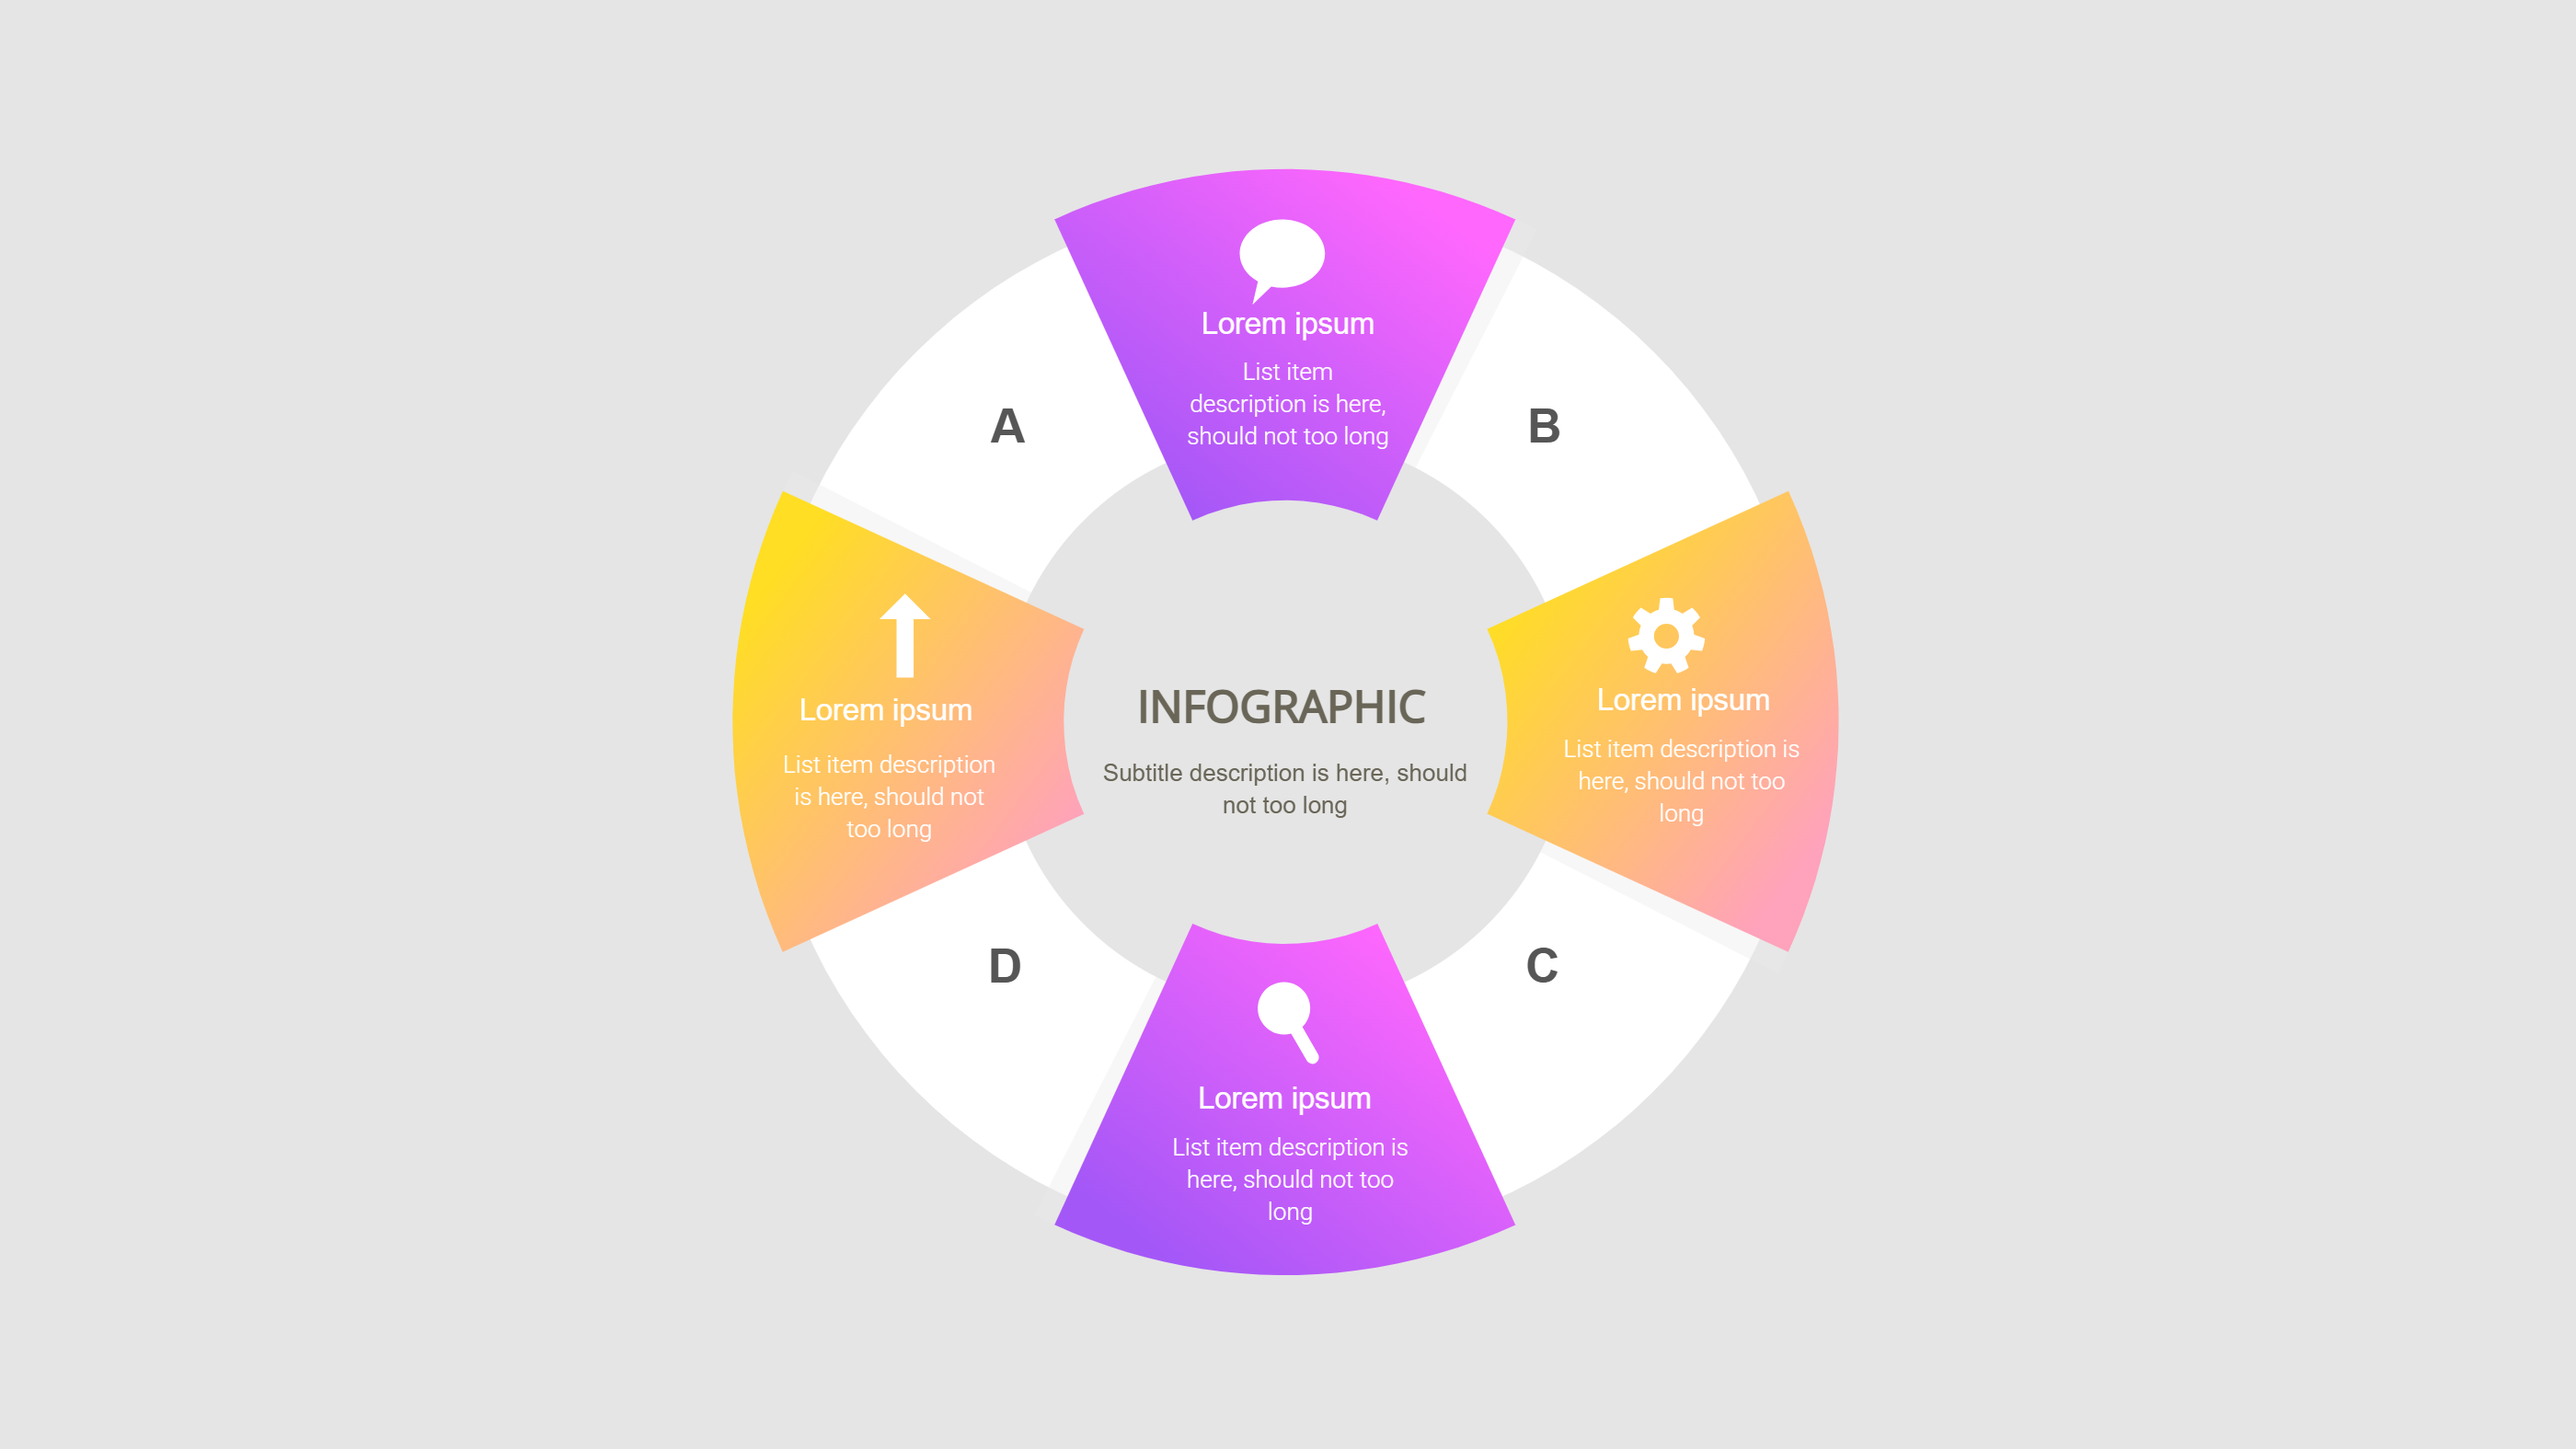
Use this infographic when you want to break numbers into clear parts. A numeric branch diagram layout lets you show a total and split it into key groups. It is useful for survey results, budget splits, and study findings. It helps the reader see how each part fits the whole.
It also works when you need a quick summary for a meeting. You can show the main numbers and a short insight line. It is easy to update when data changes. The format keeps the message direct and clear.
Download and Edit the Template
Click the download button and an online editor opens in a new page. You can edit numbers, labels, and short notes. You can adjust colors and icons to match your topic. Use the save button when you are done. Choose PPT, PNG, or SVG as the export format. The steps stay the same even if the wording is different.
How to Use Template for Statistical Analysis with Clear Numeric Highlights
Open the AI generator on the home page and choose the numeric analysis template. Enter a short prompt that lists the total, key groups, and a short insight. The tool creates an infographic that follows the layout. You can edit the result and adjust text to match your data. The meaning stays the same, even if your wording changes.
Examples of Template for Statistical Analysis AI Prompt Usage
Example 1:
A survey summary with one main total and four response groups. Show the share for each group and a short note on the largest group.
Example 2:
A monthly sales summary that splits revenue by three product lines. Include a short insight note about the top product.
Example 3:
A class study result with a total number of students and a split by grade level. Use clear labels and short values.
Example Infographic Image
[Example Image Placeholder - Image will be added manually]
Recommended Similar Infographic Templates
Related Template 1: Modern Methods for Data Analysis
Related Template 2: Waffle Chart Design Template
Related Template 3: Finance Market Share Piechart Infographic Template
Related Template 4: Premiere Pro MOGRT Infographic Charts Template
FAQs
Q: Can I use this template for survey results?
A: Yes, it is good for simple survey summaries.
Q: Can I show a total and smaller groups?
A: Yes, the branch layout is made for that.
Q: Is this template easy to update with new numbers?
A: Yes, you can edit the values quickly.
Q: Can I include a short insight line?
A: Yes, add a brief note under the main total.
Q: Can I export the chart as an image?
A: Yes, PNG and SVG export are supported.